
Compare Jay Bharat Maru. with Similar Stocks
Dashboard
With a growth in Net Profit of 308.84%, the company declared Very Positive results in Mar 26
- The company has declared positive results for the last 5 consecutive quarters
- PAT(Q) At Rs 79.59 cr has Grown at 287.1%
- ROCE(HY) Highest at 15.75%
- OPERATING PROFIT TO INTEREST(Q) Highest at 7.75 times
With ROCE of 15.4, it has a Very Attractive valuation with a 1.6 Enterprise value to Capital Employed
Market Beating performance in long term as well as near term
Stock DNA
Auto Components & Equipments
INR 1,485 Cr (Micro Cap)
10.00
36
0.50%
0.76
20.07%
2.18
Total Returns (Price + Dividend) 
Latest dividend: 0.7 per share ex-dividend date: Aug-26-2025
Risk Adjusted Returns v/s
Returns Beta

News
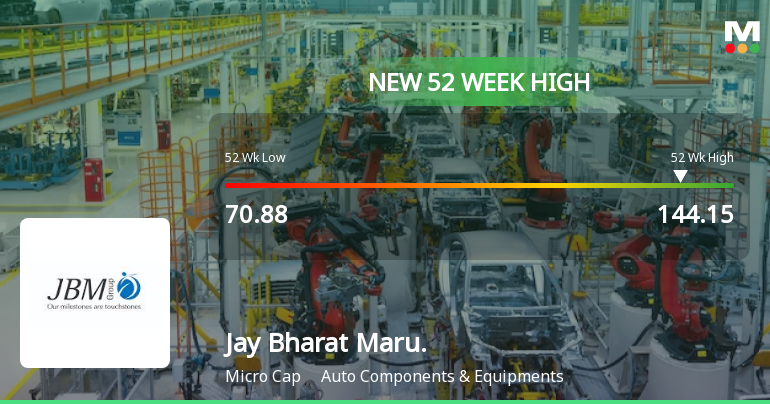
Broad-Based Technical Strength Lifts Jay Bharat Maruti Ltd to 52-Week High of Rs 144.15
Surging to a fresh 52-week high of Rs 144.15 on 09 Jun 2026, Jay Bharat Maruti Ltd has demonstrated remarkable price momentum, outpacing the broader market and its sector peers. This milestone caps a year-long rally that has seen the stock appreciate by over 71%, a stark contrast to the Sensex’s 10.33% decline over the same period.
Read full news article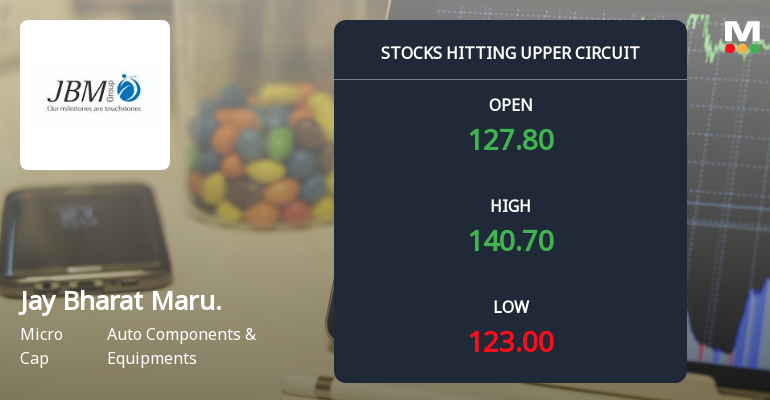
Jay Bharat Maruti Ltd Locks at Upper Circuit With 9.99% Gain — Buyers Queue, Sellers Absent
At Rs 140.76, the buying was done — not because demand dried up, but because the exchange wouldn't let the stock go any higher. Jay Bharat Maruti Ltd locked at its upper circuit of 9.99% on 8 Jun 2026, with buyers queuing and no sellers willing to part with shares.
Read full news article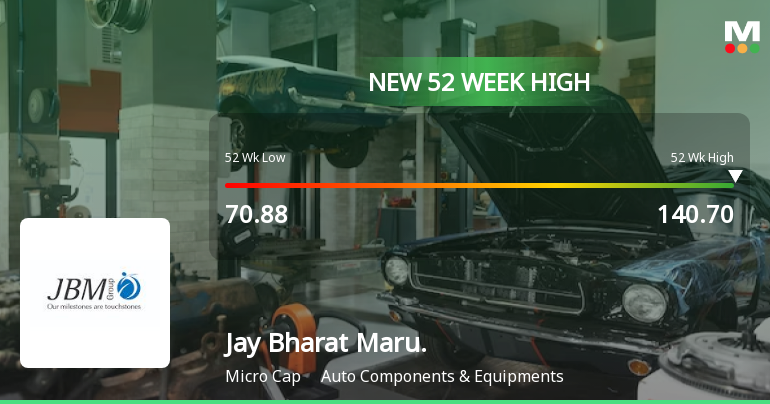
Broad-Based Technical Strength Lifts Jay Bharat Maruti Ltd to 52-Week High of Rs 136.15
Surging past its previous peak, Jay Bharat Maruti Ltd touched a fresh 52-week high of Rs 136.15 on 8 Jun 2026, marking a remarkable 74.99% gain over the past year. This milestone comes amid a backdrop of strong technical momentum and sustained earnings growth, setting the stage for a compelling price rally in a volatile market environment.
Read full news article Announcements
Intimation Of Request Received W.R.T. Special Window For Transfer And Demat Of Physical Shares
06-Jun-2026 | Source : BSEIntimation of request received w.r.t. Special Window for Transfer and Demat of Physical Shares during the period May 05 2026 to June 04 2026.
Announcement under Regulation 30 (LODR)-Change in Directorate
29-May-2026 | Source : BSERe-appointment of Mr. Madhusudan Prasad as Non-Executive Independent Director of the Company w.e.f. June 01 2026
Announcement under Regulation 30 (LODR)-Change in Management
29-May-2026 | Source : BSERe-appointment of Mr. Madhusudan Prasad as Non-Executive Independent Director of the Company w.e.f. June 01 2026.
Corporate Actions

No Upcoming Board Meetings

Jay Bharat Maruti Ltd has declared 35% dividend, ex-date: 26 Aug 25

Jay Bharat Maruti Ltd has announced 2:5 stock split, ex-date: 26 Oct 23

Jay Bharat Maruti Ltd has announced 1:1 bonus issue, ex-date: 07 Jun 21

No Rights history available
Quality key factors
Valuation key factors
Technicals key factors
 Technical Indicator Scale: Bearish, Mildly Bearish, Sideways, Mildly Bullish, Bullish Turned
 Shareholding Snapshot : Mar 2026
Shareholding Compare (%holding)
Promoters
None
Held by 4 Schemes (0.02%)
Held by 8 FIIs (1.32%)
Maruti Suzuki India Limited (29.28%)
Focal Leasing & Credits Limited (4.53%)
17.23%
Quarterly Results Snapshot (Consolidated) - Mar'26 - YoY

YoY Growth in quarter ended Mar 2026 is 25.44% vs 2.10% in Mar 2025
YoY Growth in quarter ended Mar 2026 is 287.11% vs 83.08% in Mar 2025
Half Yearly Results Snapshot (Consolidated) - Sep'25
Growth in half year ended Sep 2025 is 4.65% vs -5.03% in Sep 2024
Growth in half year ended Sep 2025 is 394.90% vs -40.93% in Sep 2024
Nine Monthly Results Snapshot (Consolidated) - Dec'25
YoY Growth in nine months ended Dec 2025 is 6.28% vs -0.86% in Dec 2024
YoY Growth in nine months ended Dec 2025 is 386.56% vs -41.16% in Dec 2024
Annual Results Snapshot (Consolidated) - Mar'26
YoY Growth in year ended Mar 2026 is 11.39% vs -0.09% in Mar 2025
YoY Growth in year ended Mar 2026 is 324.40% vs 2.17% in Mar 2025
About Jay Bharat Maruti Ltd

Company Coordinates


