
Compare Jaykay Enter. with Similar Stocks
Dashboard
Poor Management Efficiency with a low ROE of 6.97%
- The company has been able to generate a Return on Equity (avg) of 6.97% signifying low profitability per unit of shareholders funds
With ROE of 7.8, it has a Very Expensive valuation with a 3.4 Price to Book Value
Despite the size of the company, domestic mutual funds hold only 0% of the company
Stock DNA
Aerospace & Defense
INR 2,293 Cr (Small Cap)
44.00
26
0.00%
-0.01
7.85%
3.44
Total Returns (Price + Dividend) 
Jaykay Enter. for the last several years.
Risk Adjusted Returns v/s
Returns Beta

News
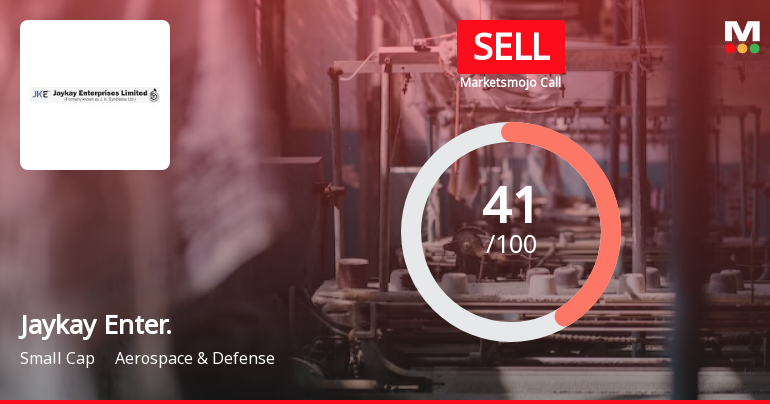
Jaykay Enterprises Ltd is Rated Sell
Jaykay Enterprises Ltd is rated 'Sell' by MarketsMOJO, with this rating last updated on 29 May 2026. However, the analysis and financial metrics discussed here reflect the stock's current position as of 24 June 2026, providing investors with the most up-to-date view of the company’s fundamentals, returns, and market standing.
Read full news article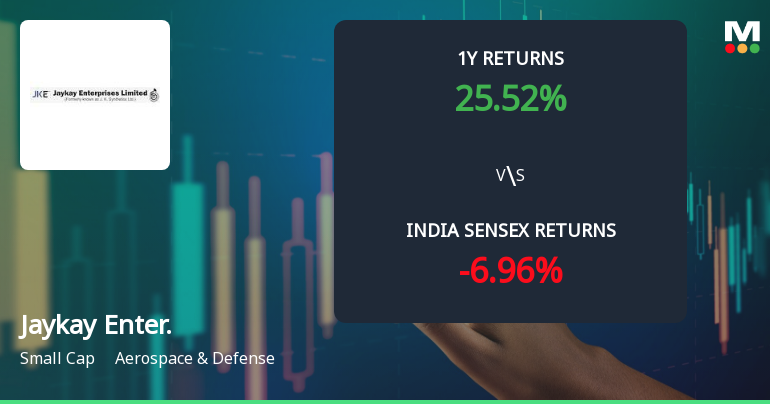
Jaykay Enterprises Ltd Faces Mixed Technical Signals Amid Mildly Bearish Momentum
Jaykay Enterprises Ltd, a small-cap player in the Aerospace & Defense sector, has experienced a notable shift in its technical momentum, reflecting a complex interplay of bullish and bearish signals across multiple timeframes. Despite a recent downgrade in its Mojo Grade to Sell from Hold, the stock’s long-term returns remain impressive, though short-term indicators suggest caution for investors.
Read full news article
Jaykay Enterprises Ltd Technical Momentum Shifts Amid Mixed Market Signals
Jaykay Enterprises Ltd, a small-cap player in the Aerospace & Defense sector, has experienced a notable shift in its technical momentum, moving from a mildly bearish stance to a sideways trend. This transition is underscored by a complex interplay of technical indicators, including MACD, RSI, moving averages, and Bollinger Bands, signalling a nuanced outlook for investors amid fluctuating price action.
Read full news article Announcements
Announcement under Regulation 30 (LODR)-Acquisition
09-Jun-2026 | Source : BSEDisclosure under Regulation 30 of SEBI Listing Regulations 2015 - Acquisition of additional share capital in JK Digital & Advance Systems Private Limited WOS of the Company
Disclosure Under Regulation 30 Of SEBI Listing Regulations 2015
09-Jun-2026 | Source : BSEDisclosure under Regulation 30 of SEBI Listing Regulations 2015 for receipt of ISO 14001:2015 and ISO 45001:2018 Certifications by JK Digital & Advance Systems Private Limited WOS of Jaykay Enterprises Limited
Announcement under Regulation 30 (LODR)-Newspaper Publication
28-May-2026 | Source : BSEAnnouncement under Regulation 30 of SEBI (LODR) - Newspaper Publication
Corporate Actions

No Upcoming Board Meetings

No Dividend history available

No Splits history available

No Bonus history available

Jaykay Enterprises Ltd has announced 1:1 rights issue, ex-date: 19 Jul 24
Quality key factors
Valuation key factors
Technicals key factors
 Technical Indicator Scale: Bearish, Mildly Bearish, Sideways, Mildly Bullish, Bullish Turned
 Shareholding Snapshot : Mar 2026
Shareholding Compare (%holding)
Promoters
None
Held by 2 Schemes (0.0%)
Held by 18 FIIs (0.18%)
Abhishek Singhania (33.71%)
None
25.33%
Quarterly Results Snapshot (Consolidated) - Mar'26 - QoQ

QoQ Growth in quarter ended Mar 2026 is 1.98% vs -4.92% in Dec 2025
QoQ Growth in quarter ended Mar 2026 is 2,841.04% vs -21.08% in Dec 2025
Half Yearly Results Snapshot (Consolidated) - Sep'25

Growth in half year ended Sep 2025 is 147.17% vs 217.76% in Sep 2024
Growth in half year ended Sep 2025 is 468.51% vs 70.03% in Sep 2024
Nine Monthly Results Snapshot (Consolidated) - Dec'25
YoY Growth in nine months ended Dec 2025 is 156.16% vs 207.91% in Dec 2024
YoY Growth in nine months ended Dec 2025 is 246.48% vs 192.84% in Dec 2024
Annual Results Snapshot (Consolidated) - Mar'26
YoY Growth in year ended Mar 2026 is 220.00% vs 53.13% in Mar 2025
YoY Growth in year ended Mar 2026 is 3,212.54% vs -18.28% in Mar 2025
About Jaykay Enterprises Ltd

Company Coordinates


