
Compare JBM Auto with Similar Stocks
Dashboard
Low ability to service debt as the company has a high Debt to EBITDA ratio of 4.30 times
- Low ability to service debt as the company has a high Debt to EBITDA ratio of 4.30 times
Healthy long term growth as Net Sales has grown by an annual rate of 25.16% and Operating profit at 32.84%
Flat results in Mar 26
With ROCE of 12, it has a Expensive valuation with a 4.2 Enterprise value to Capital Employed
Despite the size of the company, domestic mutual funds hold only 0.33% of the company
Stock DNA
Auto Components & Equipments
INR 15,798 Cr (Small Cap)
69.00
37
0.13%
1.88
14.71%
10.17
Total Returns (Price + Dividend) 
Latest dividend: 0.85 per share ex-dividend date: Aug-26-2025
Risk Adjusted Returns v/s
Returns Beta

News
JBM Auto Ltd is Rated Hold by MarketsMOJO
JBM Auto Ltd is rated 'Hold' by MarketsMOJO, with this rating last updated on 03 June 2026. However, the analysis and financial metrics discussed here reflect the company’s current position as of 29 July 2026, providing investors with an up-to-date view of the stock’s fundamentals, valuation, financial trends, and technical outlook.
Read full news article
JBM Auto Ltd Technical Momentum Shifts Amid Mixed Market Signals
JBM Auto Ltd has experienced a nuanced shift in its technical momentum, moving from a bullish to a mildly bullish stance as of late July 2026. Despite a recent dip in daily price, the stock’s medium- and long-term indicators reveal a complex interplay of signals that suggest cautious optimism for investors in the auto components sector.
Read full news article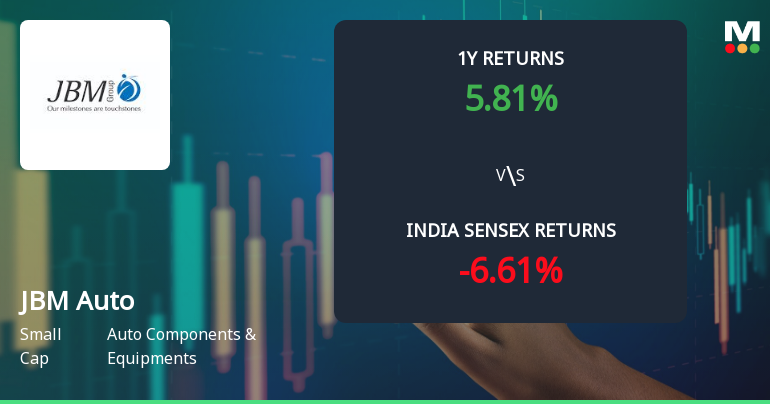
JBM Auto Ltd Technical Momentum Shifts Signal Bullish Outlook Amid Market Volatility
JBM Auto Ltd has witnessed a notable shift in its technical momentum, upgrading from a mildly bullish to a bullish stance, supported by key indicators such as MACD, moving averages, and Bollinger Bands. This technical evolution comes amid mixed market returns and a recent upgrade in the company’s mojo grade, signalling renewed investor interest in this small-cap auto components player.
Read full news article Announcements
Board Meeting Intimation for To Consider And Approve Quarterly Un-Audited Financial Results (30Th June 2026) And Fund Raising.
24-Jul-2026 | Source : BSEJBM Auto Ltdhas informed BSE that the meeting of the Board of Directors of the Company is scheduled on 30/07/2026 inter alia to consider and approve JBM Auto Ltd has informed BSE that the meeting of the Board of Directors of the Company is scheduled on 30/07/2026 inter alia to consider and approve Quarterly Un-audited Financial Results (30th June 2026) and fund raising.
Intimation Of Incorporation Of Step-Down Subsidiary Company
16-Jul-2026 | Source : BSEIntimation of Incorporation of Step-Down Subsidiary Company
Announcement under Regulation 30 (LODR)-Press Release / Media Release
13-Jul-2026 | Source : BSEPress Release dated 13th July 2026.
Corporate Actions

30 Jul 2026

JBM Auto Ltd has declared 85% dividend, ex-date: 26 Aug 25

JBM Auto Ltd has announced 1:2 stock split, ex-date: 31 Jan 25

JBM Auto Ltd has announced 1:1 bonus issue, ex-date: 08 Oct 14

No Rights history available
Quality key factors
Valuation key factors
Technicals key factors
 Technical Indicator Scale: Bearish, Mildly Bearish, Sideways, Mildly Bullish, Bullish Turned
 Shareholding Snapshot : Jun 2026
Shareholding Compare (%holding)
Promoters
None
Held by 17 Schemes (0.11%)
Held by 88 FIIs (2.03%)
Smc Credits Limited (16.35%)
Zeal Impex And Traders Private Limited (7.72%)
12.71%
Quarterly Results Snapshot (Consolidated) - Mar'26 - QoQ

QoQ Growth in quarter ended Mar 2026 is 14.76% vs 17.96% in Dec 2025

QoQ Growth in quarter ended Mar 2026 is 34.71% vs 4.71% in Dec 2025
Half Yearly Results Snapshot (Consolidated) - Sep'25
Growth in half year ended Sep 2025 is 7.88% vs 11.63% in Sep 2024
Growth in half year ended Sep 2025 is 7.84% vs 11.44% in Sep 2024
Nine Monthly Results Snapshot (Consolidated) - Dec'25
YoY Growth in nine months ended Dec 2025 is 10.70% vs 8.61% in Dec 2024
YoY Growth in nine months ended Dec 2025 is 6.62% vs 10.15% in Dec 2024
Annual Results Snapshot (Consolidated) - Mar'26
YoY Growth in year ended Mar 2026 is 11.26% vs 9.24% in Mar 2025
YoY Growth in year ended Mar 2026 is 8.36% vs 12.91% in Mar 2025
About JBM Auto Ltd

Company Coordinates


