
Compare JBM Auto with Similar Stocks
Dashboard
Low ability to service debt as the company has a high Debt to EBITDA ratio of 4.30 times
- Low ability to service debt as the company has a high Debt to EBITDA ratio of 4.30 times
Healthy long term growth as Net Sales has grown by an annual rate of 25.16% and Operating profit at 32.84%
Flat results in Mar 26
With ROCE of 12, it has a Expensive valuation with a 4.2 Enterprise value to Capital Employed
Despite the size of the company, domestic mutual funds hold only 0.32% of the company
Stock DNA
Auto Components & Equipments
INR 16,200 Cr (Small Cap)
70.00
36
0.13%
1.88
14.71%
10.41
Total Returns (Price + Dividend) 
Latest dividend: 0.85 per share ex-dividend date: Aug-26-2025
Risk Adjusted Returns v/s
Returns Beta

News
JBM Auto Ltd Technical Momentum Shifts Amid Mixed Indicator Signals
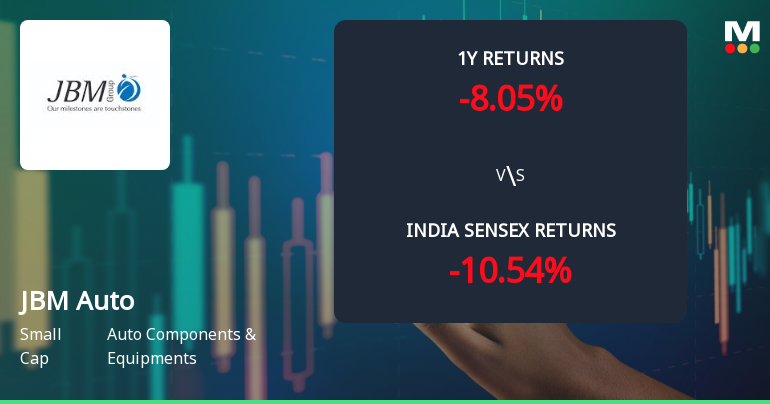
JBM Auto Ltd, a small-cap player in the Auto Components & Equipments sector, has experienced a notable shift in its technical momentum, moving from a bullish to a mildly bullish stance. Despite a day decline of 3.89% to close at ₹653.60, the stock’s technical indicators present a complex picture, with weekly and monthly signals diverging and moving averages maintaining a bullish posture. This article analyses the recent technical developments, price momentum, and relative performance against the Sensex to provide a comprehensive view for investors.
Read full news article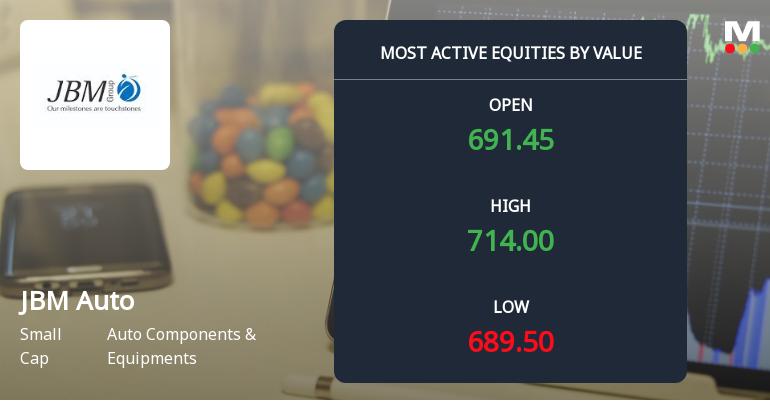
JBM Auto Ltd Sees Surge in Value Trading and Institutional Interest Amid Strong Momentum
JBM Auto Ltd (JBMA) emerged as one of the most actively traded stocks by value on 4 June 2026, registering a robust 5.7% gain intraday and outperforming its sector by 6.45%. The small-cap auto components company demonstrated strong investor participation, with total traded volume crossing 56.8 lakh shares and a turnover exceeding ₹401.7 crores, signalling heightened institutional interest and sustained buying momentum.
Read full news article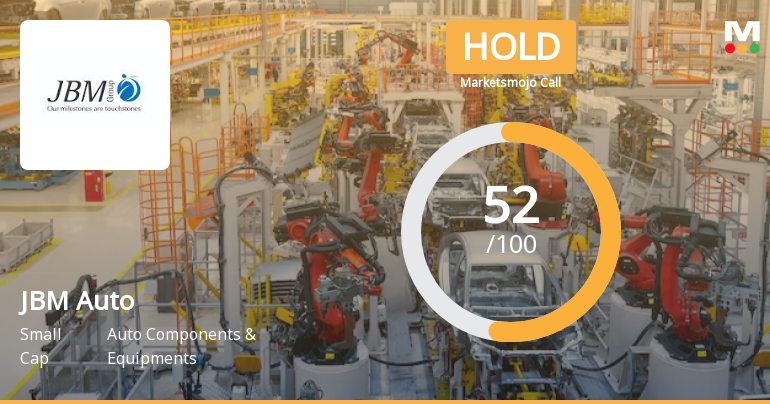
JBM Auto Ltd Upgraded to Hold by MarketsMOJO on Technical and Financial Factors
JBM Auto Ltd has seen its investment rating upgraded from Sell to Hold, reflecting a shift in technical indicators alongside steady long-term growth fundamentals. The company’s Mojo Score has improved to 52.0, signalling a more balanced outlook amid mixed financial trends and valuation concerns. This article analyses the four key parameters—Quality, Valuation, Financial Trend, and Technicals—that influenced this rating revision on 3 June 2026.
Read full news article Announcements
Announcement under Regulation 30 (LODR)-Newspaper Publication
04-Jun-2026 | Source : BSESubmission of newspaper publications with respect to completion of dispatch of postal ballot notice
Please Find The At
03-Jun-2026 | Source : BSEPress release regarding Companys electric bus market share In May 2026.
Shareholder Meeting / Postal Ballot-Notice of Postal Ballot
03-Jun-2026 | Source : BSEJBM Auto Limited has informed the exchange regarding notice of postal ballot.
Corporate Actions

No Upcoming Board Meetings

JBM Auto Ltd has declared 85% dividend, ex-date: 26 Aug 25

JBM Auto Ltd has announced 1:2 stock split, ex-date: 31 Jan 25

JBM Auto Ltd has announced 1:1 bonus issue, ex-date: 08 Oct 14

No Rights history available
Quality key factors
Valuation key factors
Technicals key factors
 Technical Indicator Scale: Bearish, Mildly Bearish, Sideways, Mildly Bullish, Bullish Turned
 Shareholding Snapshot : Mar 2026
Shareholding Compare (%holding)
Promoters
None
Held by 17 Schemes (0.1%)
Held by 86 FIIs (1.97%)
Smc Credits Limited (16.35%)
Zeal Impex And Traders Private Limited (7.72%)
12.89%
Quarterly Results Snapshot (Consolidated) - Mar'26 - QoQ

QoQ Growth in quarter ended Mar 2026 is 14.76% vs 17.96% in Dec 2025

QoQ Growth in quarter ended Mar 2026 is 34.71% vs 4.71% in Dec 2025
Half Yearly Results Snapshot (Consolidated) - Sep'25
Growth in half year ended Sep 2025 is 7.88% vs 11.63% in Sep 2024
Growth in half year ended Sep 2025 is 7.84% vs 11.44% in Sep 2024
Nine Monthly Results Snapshot (Consolidated) - Dec'25
YoY Growth in nine months ended Dec 2025 is 10.70% vs 8.61% in Dec 2024
YoY Growth in nine months ended Dec 2025 is 6.62% vs 10.15% in Dec 2024
Annual Results Snapshot (Consolidated) - Mar'26
YoY Growth in year ended Mar 2026 is 11.26% vs 9.24% in Mar 2025
YoY Growth in year ended Mar 2026 is 8.36% vs 12.91% in Mar 2025
About JBM Auto Ltd

Company Coordinates


