
Compare Jewett-Cameron Trading Co. Ltd. with Similar Stocks
Dashboard
Poor long term growth as Operating profit has grown by an annual rate -201.59% of over the last 5 years
With a fall in Net Sales of -20.7%, the company declared Very Negative results in May 25
Risky - Negative EBITDA
Consistent Underperformance against the benchmark over the last 3 years
Stock DNA
Trading & Distributors
USD 7 Million (Micro Cap)
NA (Loss Making)
NA
0.00%
0.19
-44.04%
0.40
Total Returns (Price + Dividend) 
Jewett-Cameron Trading Co. Ltd. for the last several years.
Risk Adjusted Returns v/s
News
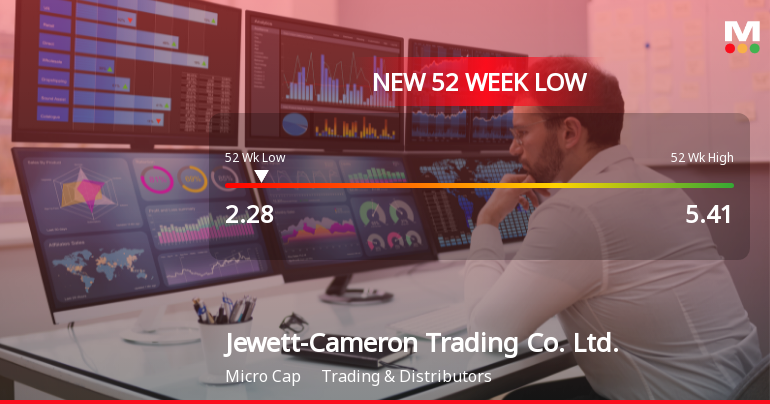
Jewett-Cameron Trading Co. Stock Hits New 52-Week Low at $2.28
Jewett-Cameron Trading Co. has reached a new 52-week low, trading at USD 2.28 as of November 25, 2025. The company has seen a significant decline in stock price over the past year, alongside negative financial results, including a drop in net sales and ongoing operating profit challenges.
Read full news article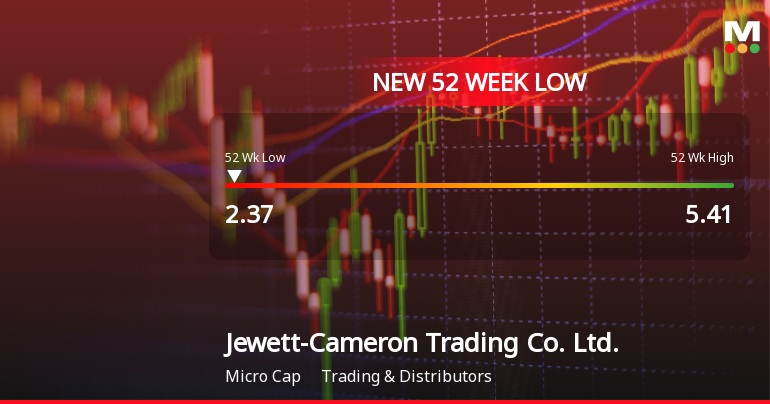
Jewett-Cameron Trading Co. Stock Plummets to 52-Week Low of $2.37
Jewett-Cameron Trading Co. has hit a new 52-week low, reflecting a significant decline in its stock price over the past year. The company has reported negative financial metrics, including a return on equity of -9.00% and declining net sales, indicating ongoing challenges in achieving sustainable growth.
Read full news article
Jewett-Cameron Trading Co. Stock Plummets to New 52-Week Low at $2.40
Jewett-Cameron Trading Co. has hit a new 52-week low, reflecting significant challenges in its performance over the past year. The company has reported negative financial metrics, including declining net sales and operating profit, alongside a concerning return on equity and lack of dividends, indicating ongoing financial difficulties.
Read full news article Announcements

Corporate Actions
Quality key factors
Valuation key factors
Technicals key factors
 Technical Indicator Scale: Bearish, Mildly Bearish, Sideways, Mildly Bullish, Bullish Turned
 Shareholding Snapshot : Nov 2025
Shareholding Compare (%holding)
Domestic Funds
Held in 2 Schemes (3.1%)
Held by 1 Foreign Institutions (0.9%)
Quarterly Results Snapshot (Consolidated) - Nov'25 - YoY

YoY Growth in quarter ended Nov 2025 is -6.45% vs -5.10% in Nov 2024
YoY Growth in quarter ended Nov 2025 is -457.14% vs -153.85% in Nov 2024
Annual Results Snapshot (Consolidated) - Aug'25

YoY Growth in year ended Aug 2025 is -12.31% vs -13.26% in Aug 2024
YoY Growth in year ended Aug 2025 is -685.71% vs 0.00% in Aug 2024
About Jewett-Cameron Trading Co. Ltd.

Company Coordinates


