
Compare JFL Life with Similar Stocks
Stock DNA
Pharmaceuticals & Biotechnology
INR 65 Cr (Micro Cap)
10.00
34
0.00%
0.44
13.95%
1.42
Total Returns (Price + Dividend) 
Latest dividend: 0.20000000000000004 per share ex-dividend date: Sep-13-2024
Risk Adjusted Returns v/s
Returns Beta

News
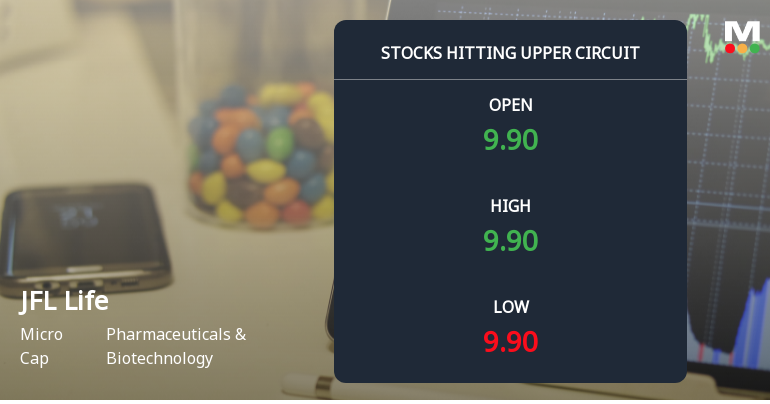
JFL Life Sciences Ltd Locks at Upper Circuit With 4.76% Gain — Buyers Queue, Sellers Absent
At Rs 9.90, the buying was done — not because demand dried up, but because the exchange wouldn't let the stock go any higher. JFL Life Sciences Ltd locked at its upper circuit of 4.76% on 2 Jun 2026, with buyers queuing and no sellers willing to part with shares.
Read full news article
JFL Life Sciences Ltd Locks at Upper Circuit With 5.0% Gain — Buyers Queue, Sellers Absent
At Rs 9.45, the buying was done — not because demand dried up, but because the exchange wouldn't let the stock go any higher. JFL Life Sciences Ltd locked at its upper circuit of 5.0% on 1 Jun 2026, with buyers queuing and no sellers willing to part with shares.
Read full news article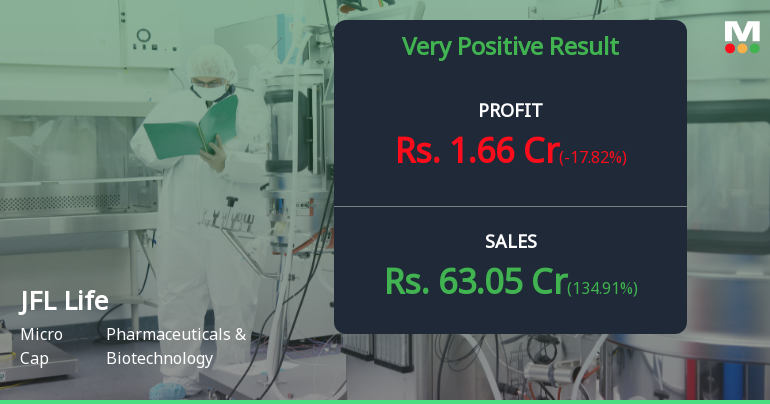
JFL Life Sciences Q4 FY26: Revenue Surge Masks Margin Erosion Concerns
JFL Life Sciences Ltd., a micro-cap pharmaceutical manufacturer with a market capitalisation of ₹57.00 crores, reported a dramatic 134.91% quarter-on-quarter revenue surge to ₹63.05 crores in Q4 FY26, marking the company's strongest quarterly sales performance on record. However, this topline expansion came at a significant cost to profitability, with operating margins contracting sharply to 5.57% from 12.48% in the previous quarter, raising critical questions about the sustainability and quality of this growth trajectory.
Read full news article Announcements
Corporate Actions

No Upcoming Board Meetings

JFL Life Sciences Ltd has declared 2% dividend, ex-date: 13 Sep 24

No Splits history available

JFL Life Sciences Ltd has announced 2:1 bonus issue, ex-date: 24 Sep 24

JFL Life Sciences Ltd has announced 1:1 rights issue, ex-date: 10 Mar 26
Quality key factors
Valuation key factors
Technicals key factors
 Technical Indicator Scale: Bearish, Mildly Bearish, Sideways, Mildly Bullish, Bullish Turned
 Shareholding Snapshot : Mar 2026
Shareholding Compare (%holding)
Promoters
None
Held by 0 Schemes
Held by 0 FIIs
Smiral Ashwinkumar Patel (44.33%)
Pratik Rajendrabhai Gandhi (1.22%)
28.49%
Quarterly Results Snapshot (Standalone) - Mar'26 - QoQ

QoQ Growth in quarter ended Mar 2026 is 134.91% vs -10.26% in Dec 2025

QoQ Growth in quarter ended Mar 2026 is -17.82% vs 2.54% in Dec 2025
Half Yearly Results Snapshot (Standalone) - Sep'25
Growth in half year ended Sep 2025 is -15.43% vs 79.71% in Sep 2024
Growth in half year ended Sep 2025 is -19.05% vs 45.45% in Sep 2024
Nine Monthly Results Snapshot (Standalone) - Dec'25
YoY Growth in nine months ended Dec 2025 is -2.82% vs -16.04% in Dec 2024
YoY Growth in nine months ended Dec 2025 is 15.61% vs 38.05% in Dec 2024
Annual Results Snapshot (Standalone) - Mar'26
YoY Growth in year ended Mar 2026 is 60.14% vs 76.24% in Mar 2025
YoY Growth in year ended Mar 2026 is 53.85% vs 26.06% in Mar 2025
About JFL Life Sciences Ltd

Company Coordinates


