
Compare Jindal Capital with Similar Stocks
Stock DNA
Non Banking Financial Company (NBFC)
INR 23 Cr (Micro Cap)
20.00
21
0.00%
1.16
9.24%
1.92
Total Returns (Price + Dividend) 
Jindal Capital for the last several years.
Risk Adjusted Returns v/s
Returns Beta

News

Jindal Capital Ltd Valuation Shifts Signal Renewed Price Attractiveness Amid NBFC Sector Dynamics
Jindal Capital Ltd, a micro-cap player in the Non Banking Financial Company (NBFC) sector, has seen a notable shift in its valuation parameters, moving from an attractive to a very attractive rating. Despite a challenging year-to-date performance and a strong sell Mojo Grade, the company’s price-to-earnings (P/E) and price-to-book value (P/BV) ratios suggest a compelling valuation relative to its peers and historical benchmarks.
Read full news article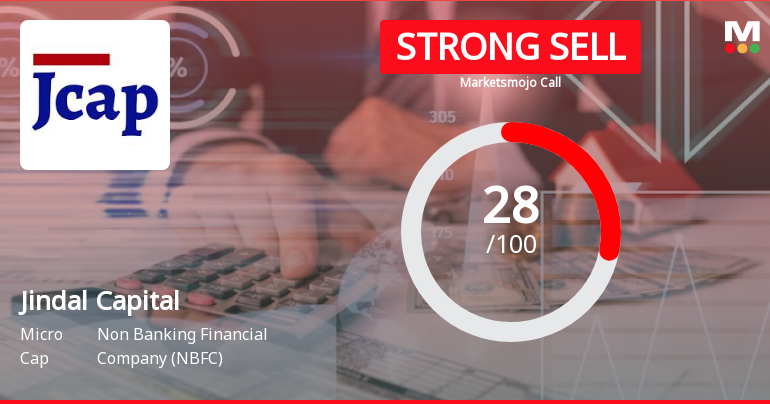
Jindal Capital Ltd is Rated Strong Sell
Jindal Capital Ltd is rated Strong Sell by MarketsMOJO, with this rating last updated on 19 Feb 2025. However, the analysis and financial metrics discussed here reflect the stock’s current position as of 10 July 2026, providing investors with an up-to-date view of the company’s fundamentals, valuation, financial trend, and technical outlook.
Read full news article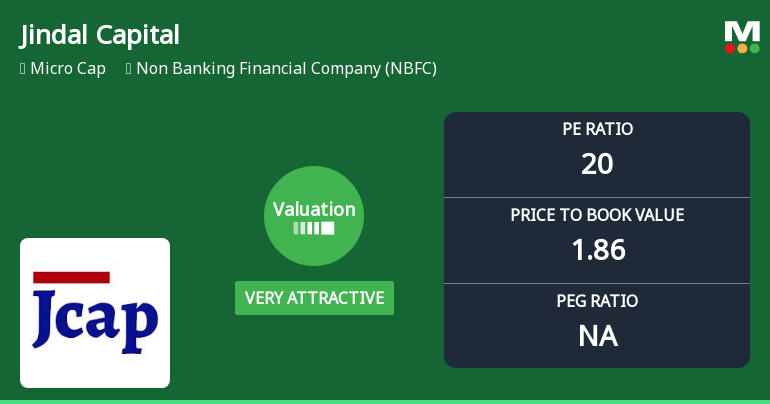
Jindal Capital Ltd Valuation Shifts to Very Attractive Amid Mixed Market Returns
Jindal Capital Ltd, a micro-cap player in the Non Banking Financial Company (NBFC) sector, has witnessed a notable shift in its valuation parameters, moving from an attractive to a very attractive price level. This change is underscored by a recalibration of key metrics such as the price-to-earnings (P/E) and price-to-book value (P/BV) ratios, positioning the stock as a compelling consideration for investors despite ongoing sector headwinds and a recent downgrade to a Strong Sell rating by MarketsMOJO.
Read full news article Announcements
Compliances-Certificate under Reg. 74 (5) of SEBI (DP) Regulations 2018
13-Jul-2026 | Source : BSEAs per Attachment
Closure of Trading Window
29-Jun-2026 | Source : BSEAs per the attachment.
Announcement under Regulation 30 (LODR)-Newspaper Publication
28-May-2026 | Source : BSEAs per Attatchment
Corporate Actions

No Upcoming Board Meetings

No Dividend history available

No Splits history available

No Bonus history available

No Rights history available
Quality key factors
Valuation key factors
Technicals key factors
 Technical Indicator Scale: Bearish, Mildly Bearish, Sideways, Mildly Bullish, Bullish Turned
 Shareholding Snapshot : Mar 2026
Shareholding Compare (%holding)
Promoters
None
Held by 0 Schemes
Held by 0 FIIs
Cmv Informatics Private Limited (13.07%)
Sunil Sharma (1.05%)
27.27%
Quarterly Results Snapshot (Standalone) - Dec'25 - YoY

YoY Growth in quarter ended Dec 2025 is -19.20% vs 177.78% in Dec 2024
YoY Growth in quarter ended Dec 2025 is -44.00% vs 194.12% in Dec 2024
Half Yearly Results Snapshot (Standalone) - Sep'25

Growth in half year ended Sep 2025 is -1.69% vs -5.35% in Sep 2024
Growth in half year ended Sep 2025 is -54.05% vs 42.31% in Sep 2024
Nine Monthly Results Snapshot (Standalone) - Dec'25
YoY Growth in nine months ended Dec 2025 is -8.94% vs 30.17% in Dec 2024
YoY Growth in nine months ended Dec 2025 is -50.93% vs 69.47% in Dec 2024
Annual Results Snapshot (Standalone) - Mar'26
YoY Growth in year ended Mar 2026 is 8.18% vs 30.24% in Mar 2025
YoY Growth in year ended Mar 2026 is -19.29% vs 26.13% in Mar 2025
About Jindal Capital Ltd

Company Coordinates


