
Compare Jindal Hotels with Similar Stocks
Dashboard
High Debt company with Weak Long Term Fundamental Strength
- High Debt Company with a Debt to Equity ratio (avg) of 2.55 times
- The company has been able to generate a Return on Equity (avg) of 7.63% signifying low profitability per unit of shareholders funds
Underperformed the market in the last 1 year
Total Returns (Price + Dividend) 
Latest dividend: 0.8000000000000002 per share ex-dividend date: Sep-04-2017
Risk Adjusted Returns v/s
Returns Beta

News

Jindal Hotels Ltd is Rated Sell
Jindal Hotels Ltd is rated Sell by MarketsMOJO, with this rating last updated on 21 May 2026. However, the analysis and financial metrics discussed here reflect the company’s current position as of 16 July 2026, providing investors with an up-to-date view of the stock’s fundamentals, valuation, financial trend, and technical outlook.
Read full news article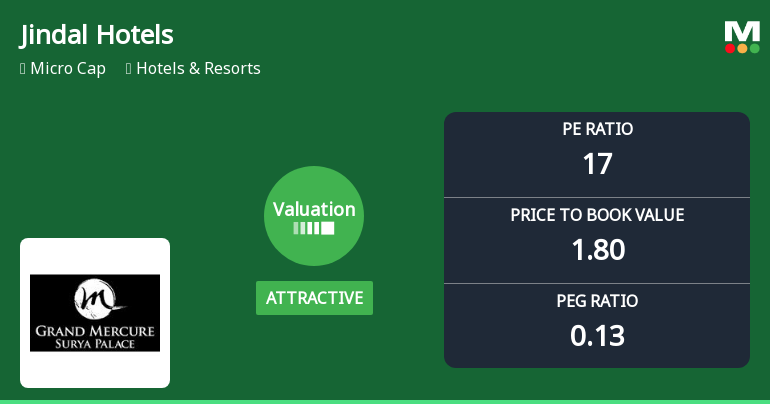
Jindal Hotels Ltd Valuation Improves Amid Mixed Market Returns
Jindal Hotels Ltd has witnessed a notable improvement in its valuation parameters, shifting from a very attractive to an attractive rating, despite a challenging year-to-date performance. The company’s price-to-earnings (P/E) ratio now stands at 16.66, reflecting a more favourable price attractiveness compared to its historical averages and peer group, signalling potential value for discerning investors in the Hotels & Resorts sector.
Read full news article
Jindal Hotels Ltd is Rated Sell
Jindal Hotels Ltd is rated Sell by MarketsMOJO, with this rating last updated on 21 May 2026. While the rating change occurred on that date, the analysis and financial metrics discussed here reflect the stock’s current position as of 01 July 2026, providing investors with an up-to-date perspective on the company’s fundamentals, valuation, financial trends, and technical outlook.
Read full news article Announcements
Closure of Trading Window
17-Jul-2026 | Source : BSEIntimation for Closure of Trading Window pursuant to SEBI (Prohibition of Insider Trading) Regulations 2018 & Amendments for approval of Unaudited Standalone Financial Results for the 1st Quarter of FY 2026-27 ended on 30.06.2026.
Board Meeting Intimation for Consideration And Approval Of Unaudited Financial Results For The 1St Quarter Of FY 2026-27 Ended On 30.06.2026.
17-Jul-2026 | Source : BSEJindal Hotels Ltdhas informed BSE that the meeting of the Board of Directors of the Company is scheduled on 24/07/2026 inter alia to consider and approve Unaudited Standalone Financial Results for the 1st quarter of FY 2026-27 ended on 30.06.2026.
Compliances-Certificate under Reg. 74 (5) of SEBI (DP) Regulations 2018
08-Jul-2026 | Source : BSEIntimation of Confirmation Certificate under Regulation 74 (5) of SEBI (Depositories and Participants) Regulation 2018 for the quarter ended on 30th June 2026.
Corporate Actions

No Upcoming Board Meetings

Jindal Hotels Ltd has declared 8% dividend, ex-date: 04 Sep 17

No Splits history available

No Bonus history available

No Rights history available
Quality key factors
Valuation key factors
Technicals key factors
 Technical Indicator Scale: Bearish, Mildly Bearish, Sideways, Mildly Bullish, Bullish Turned
 Shareholding Snapshot : Mar 2026
Shareholding Compare (%holding)
Promoters
None
Held by 0 Schemes
Held by 0 FIIs
Piyush Daudayal Shah (17.13%)
Rakhi Himanshu Agrawal (1.39%)
23.94%
Quarterly Results Snapshot (Standalone) - Mar'26 - QoQ

QoQ Growth in quarter ended Mar 2026 is 3.31% vs 51.57% in Dec 2025
QoQ Growth in quarter ended Mar 2026 is 180.00% vs 1,183.33% in Dec 2025
Half Yearly Results Snapshot (Standalone) - Sep'25

Growth in half year ended Sep 2025 is 4.94% vs 2.59% in Sep 2024
Growth in half year ended Sep 2025 is 78.31% vs -38.33% in Sep 2024
Nine Monthly Results Snapshot (Standalone) - Dec'25
YoY Growth in nine months ended Dec 2025 is 3.57% vs 6.74% in Dec 2024
YoY Growth in nine months ended Dec 2025 is -60.81% vs 3,600.00% in Dec 2024
Annual Results Snapshot (Standalone) - Mar'26
YoY Growth in year ended Mar 2026 is 7.98% vs 4.22% in Mar 2025
YoY Growth in year ended Mar 2026 is 81.90% vs -51.67% in Mar 2025
About Jindal Hotels Ltd

Company Coordinates


