
Compare Jindal Photo with Similar Stocks
Dashboard
The company has declared Negative results for the last 3 consecutive quarters
- PBT LESS OI(Q) At Rs -5.64 cr has Fallen at -253.7% (vs previous 4Q average)
- PAT(Q) At Rs -5.66 cr has Fallen at -287.1% (vs previous 4Q average)
- ROCE(HY) Lowest at -1.34%
With ROE of -2.2, it has a Very Expensive valuation with a 1.1 Price to Book Value
Despite the size of the company, domestic mutual funds hold only 0.03% of the company
Stock DNA
FMCG
INR 1,168 Cr (Micro Cap)
NA (Loss Making)
32
0.00%
0.06
-2.23%
1.15
Total Returns (Price + Dividend) 
Latest dividend: 1.0000 per share ex-dividend date: Sep-21-2012
Risk Adjusted Returns v/s
Returns Beta

News

Jindal Photo Ltd Upgraded to Sell on Technical Improvements Despite Financial Challenges
Jindal Photo Ltd has seen its investment rating upgraded from Strong Sell to Sell as of 9 June 2026, primarily driven by a shift in technical indicators signalling stabilisation. However, the company continues to face significant financial headwinds, with negative quarterly results and expensive valuation metrics tempering optimism. This article analyses the four key parameters—Quality, Valuation, Financial Trend, and Technicals—that influenced the recent rating change.
Read full news article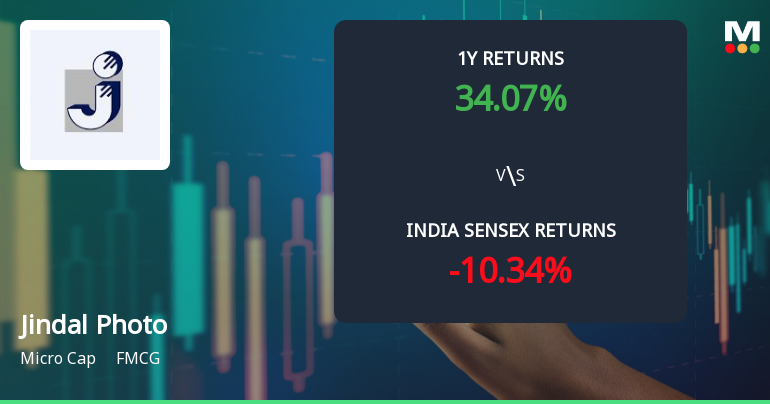
Jindal Photo Ltd Technical Momentum Shifts Amid Mixed Market Signals
Jindal Photo Ltd, a micro-cap player in the FMCG sector, has exhibited a notable shift in its technical momentum, moving from a mildly bearish stance to a sideways trend. Despite a modest day gain of 1.38%, the stock’s technical indicators present a complex picture, with mixed signals from MACD, RSI, moving averages, and other momentum oscillators. This analysis delves into the recent technical parameter changes, placing them in the context of the company’s price action and broader market performance.
Read full news article
Jindal Photo Ltd is Rated Strong Sell
Jindal Photo Ltd is rated Strong Sell by MarketsMOJO. This rating was last updated on 22 April 2026, reflecting a reassessment of the stock’s outlook. However, all fundamentals, returns, and financial metrics discussed here are current as of 08 June 2026, providing investors with the latest comprehensive view of the company’s position.
Read full news article Announcements
Board Meeting Outcome for Considered And Approved Subject To The Consent Received From Holders Of Redeemable Preference Shares The Extension Of Tenure Of Redeemable Preference Shares.
05-Jun-2026 | Source : BSEThe Board at its meeting held on Friday June 05 2026 inter-alia considered and approved subject to the consent received from holders of Redeemable Preference Shares the extension of tenure of redeemable preference shares by 5 years.
Extension Of Tenure Of Redeemable Preference Shares
05-Jun-2026 | Source : BSEThe Board at its meeting held on Friday June 05 2026 inter-alia considered and approved subject to the consent received from holders of Redeemable Preference Shares the extension of tenure of redeemable preference shares
Announcement under Regulation 30 (LODR)-Newspaper Publication
02-Jun-2026 | Source : BSESubmission of copy of newspapers for publishing of Audited Financial Results (Standalone and Consolidated) for the quarter and year ended March 31 2026
Corporate Actions

No Upcoming Board Meetings

Jindal Photo Ltd has declared 10% dividend, ex-date: 21 Sep 12

No Splits history available

No Bonus history available

No Rights history available
Quality key factors
Valuation key factors
Technicals key factors
 Technical Indicator Scale: Bearish, Mildly Bearish, Sideways, Mildly Bullish, Bullish Turned
 Shareholding Snapshot : Mar 2026
Shareholding Compare (%holding)
Promoters
None
Held by 2 Schemes (0.01%)
Held by 1 FIIs (0.01%)
Concatenate Power Advest Private Limited (73.18%)
Monet Securities Private Ltd (4.91%)
17.36%
Quarterly Results Snapshot (Consolidated) - Mar'26 - QoQ

QoQ Growth in quarter ended Mar 2026 is -28.12% vs -94.15% in Dec 2025
QoQ Growth in quarter ended Mar 2026 is 95.16% vs -346.50% in Dec 2025
Half Yearly Results Snapshot (Consolidated) - Sep'25
Growth in half year ended Sep 2025 is 697.22% vs 60.00% in Sep 2024

Growth in half year ended Sep 2025 is -42.00% vs 116.90% in Sep 2024
Nine Monthly Results Snapshot (Consolidated) - Dec'25
YoY Growth in nine months ended Dec 2025 is 531.25% vs 44.36% in Dec 2024
YoY Growth in nine months ended Dec 2025 is -108.70% vs 16.13% in Dec 2024
Annual Results Snapshot (Consolidated) - Mar'26
YoY Growth in year ended Mar 2026 is 411.38% vs -87.88% in Mar 2025
YoY Growth in year ended Mar 2026 is -110.09% vs -14.92% in Mar 2025
About Jindal Photo Ltd

Company Coordinates


