Jindal Poly Inve

  • Market Cap: Micro Cap
  • Industry: Non Banking Financial Company (NBFC)
  • ISIN: INE147P01019
  • NSEID: JPOLYINVST
  • BSEID: 536773
INR
1,103.00
-7.2 (-0.65%)
BSENSE

Jun 10, 02:43 PM

BSE+NSE Vol: 11.12 k

  • Price Points
  • Score
  • Mojo Parameters
  • Total Return
  • News and Corporate Actions
  • Key factors
  • Shareholding
  • Financials
  • CompanyCV
stock-summaryPrice Point
High/Low

1Day

52 Week

Valuation
Technical
Day's Volume

CASH

11.12 k (-77.74%) Volume

Shareholding (Mar 2026)

FII

0.19%

Held by 6 FIIs

DII

0.45%

Held by 1 DIIs

Promoter

74.63%

Why is Jindal Poly Investment & Finance Company Ltd falling/rising?

09-Jun-2026

As of 09-Jun, Jindal Poly Investment & Finance Company Ltd's stock price is rising, currently at 1,110.20, reflecting a strong performance with a 1-year increase of 32.32% and a remarkable 3160.50% rise over five years, significantly outperforming the Sensex. Increased investor participation and trading above key moving averages further indicate a robust upward trend.

As of 09-Jun, Jindal Poly Investment & Finance Company Ltd's stock price is rising, currently at 1,110.20, reflecting an increase of 18.75 (1.72%). The stock has shown strong performance relative to the benchmark Sensex, outperforming it by 1.25% today. It opened with a gain of 2.33% and reached an intraday high of Rs 1135.95, which is a 4.08% increase. <BR><BR>In terms of longer-term performance, the stock has demonstrated significant growth, with a 1-year increase of 32.32% compared to a decline of 10.34% in the Sensex. Over the past three years, it has risen by 85.64%, while the Sensex has only increased by 18.03%. The stock's performance over five years is particularly notable, with a staggering increase of 3160.50% against the Sensex's 42.31%.<BR><BR>Additionally, there has been a notable rise in investor participation, with delivery volume on June 8 increasing by 91.88% compared to the five-day average. The stock is also trading above its 5-day, 20-day, 50-day, 100-day, and 200-day moving averages, indicating a strong upward trend. Overall, these factors contribute to the rising stock price of Jindal Poly Investment & Finance Company Ltd.

View full answer

Should I buy, sell or hold Jindal Poly Investment & Finance Company Ltd?

02-Jun-2026

Are Jindal Poly Investment & Finance Company Ltd latest results good or bad?

02-Jun-2026

Jindal Poly Investment & Finance Company Ltd's latest results show strong year-on-year sales growth of 503.83%, but a concerning 47.25% decline in net profit raises profitability concerns. Overall, while revenue growth is impressive, the significant drop in profits suggests mixed performance.

Jindal Poly Investment & Finance Company Ltd's latest results present a mixed picture. On one hand, the company reported a significant year-on-year increase in net sales of 503.83%, reaching ₹47.28 crores in Q4 FY26, compared to ₹7.83 crores in the same quarter last year. This indicates strong revenue growth relative to the previous year.<BR><BR>However, the consolidated net profit saw a sharp decline of 47.25% year-on-year, totaling ₹35.16 crores, which raises concerns about profitability. Additionally, there was a staggering sequential decline of 94.99% in net profit compared to the previous quarter, reflecting a normalization after an exceptional performance in Q3 FY26, where net sales peaked at ₹961.80 crores.<BR><BR>The operating margin remains exceptionally high at 99.73%, showcasing the efficiency of the company's asset-light business model. Furthermore, the return on equity (ROE) stands at a healthy 13.47%, indicating effective capital management.<BR><BR>In summary, while the year-on-year sales growth is impressive, the significant drop in profits and the volatility in earnings suggest that the company's recent results are not entirely positive. Investors should consider the broader context of these fluctuations and the inherent volatility of the investment holding company model.

View full answer

When is the next results date for Jindal Poly Investment & Finance Company Ltd?

27-May-2026

The next results date for Jindal Poly Investment & Finance Company Ltd is 30 May 2026.

The next results date for Jindal Poly Investment & Finance Company Ltd is scheduled for 30 May 2026.

View full answer

Is Jindal Poly Inve overvalued or undervalued?

04-Dec-2025

As of December 3, 2025, Jindal Poly Inve is fairly valued with a PE ratio of 5.37, indicating no significant upside potential compared to its peers, despite outperforming the Sensex year-to-date.

As of 3 December 2025, Jindal Poly Inve's valuation grade has moved from attractive to fair, indicating a shift in its perceived value. The company is currently fairly valued, with a PE ratio of 5.37, a Price to Book Value of 0.72, and an EV to EBIT of 28.24. These ratios suggest that while the company is not undervalued, it does not present significant upside potential at its current price.<BR><BR>In comparison to its peers, Jindal Poly Inve's PE ratio is notably lower than that of Bajaj Finance, which stands at 34.68, and Life Insurance, which has a PE of 10.75, highlighting its relative valuation within the sector. Additionally, while Jindal Poly Inve has outperformed the Sensex in various time frames, including a 28.27% return year-to-date compared to the Sensex's 8.92%, the overall valuation suggests that it is currently fairly positioned in the market.

View full answer

Is Jindal Poly Inve technically bullish or bearish?

03-Dec-2025

As of December 2, 2025, the market trend is bullish with strong indicators like a bullish MACD and Bollinger Bands, despite some caution from a bearish weekly RSI and mildly bearish KST on the monthly.

As of 2 December 2025, the technical trend has changed from mildly bullish to bullish. The current stance is bullish with strong indicators supporting this view. The MACD is bullish on both the weekly and monthly time frames, and Bollinger Bands also indicate a bullish trend on both time frames. Daily moving averages confirm a bullish outlook. However, the weekly RSI is bearish, which suggests some caution, while the KST shows a mildly bearish signal on the monthly. Overall, the strength of the bullish trend is supported by the recent price action, with a notable return of 10.17% over the past week compared to the Sensex's 0.65%.

View full answer

How has been the historical performance of Jindal Poly Inve?

03-Dec-2025

Jindal Poly Inve's historical performance has shown significant declines in net sales, operating income, and profits from March 2023 to March 2025, despite a slight increase in profit after tax and stable consolidated net profit. Total liabilities and assets also decreased, indicating a challenging financial period.

Answer:<BR>The historical performance of Jindal Poly Inve shows significant fluctuations in its financial metrics over the years.<BR><BR>Breakdown:<BR>Jindal Poly Inve's net sales experienced a dramatic decline from 3,105.79 crore in March 2023 to 31.69 crore in March 2025, following a peak in March 2023. The total operating income mirrored this trend, dropping from 3,105.79 crore in March 2023 to 31.69 crore in March 2025. The company reported total expenditure excluding depreciation of 0.38 crore in March 2025, a stark contrast to 1,995.59 crore in March 2023. Operating profit (PBDIT) also fell significantly from 1,145.47 crore in March 2023 to 31.31 crore in March 2025, while profit before tax decreased from 746.94 crore to 29.82 crore in the same period. Despite these declines, profit after tax showed a slight increase from 493.75 crore in March 2023 to 55.64 crore in March 2025. The consolidated net profit remained relatively stable, increasing from 281.09 crore in March 2023 to 295.84 crore in March 2025. On the balance sheet, total liabilities decreased from 2,422.00 crore in March 2023 to 1,568.51 crore in March 2025, while total assets also fell from 2,422.00 crore to 1,568.51 crore. The cash flow from operating activities was positive at 1.00 crore in March 2025, compared to 1,084.00 crore in March 2023, indicating a significant reduction in cash generation capabilities. Overall, Jindal Poly Inve's financial performance reflects a challenging period marked by substantial declines in revenue and operating metrics, alongside a modest recovery in net profit.

View full answer

How big is Jindal Poly Inve?

24-Jul-2025

As of 24th July, Jindal Poly Investment & Finance Company Ltd has a market capitalization of 851.00 Cr, with Net Sales of 31.69 Cr and a Net Profit of 295.84 Cr reported in the latest four quarters. Shareholder's Funds are 1,524.50 Cr and Total Assets are 1,568.51 Cr for the annual period ending March 2025.

As of 24th July, Jindal Poly Investment & Finance Company Ltd has a market capitalization of 851.00 Cr, classifying it as a Micro Cap company.<BR><BR>In the latest four quarters, the company reported Net Sales of 31.69 Cr and a Net Profit of 295.84 Cr.<BR><BR>For the latest annual period ending in March 2025, the Shareholder's Funds amounted to 1,524.50 Cr, while Total Assets were reported at 1,568.51 Cr.

View full answer

Who are in the management team of Jindal Poly Inve?

16-Jul-2025

As of March 2022, the management team of Jindal Poly Inve includes G D Singhal (Managing Director), Vinumon K Govindan, Iti Goyal, Prakash Matai (Executive Director), and independent directors Suresh Chander Sharma and Radhey Shyam.

As of March 2022, the management team of Jindal Poly Inve includes the following individuals:<BR><BR>1. G D Singhal - Managing Director<BR>2. Vinumon K Govindan - Independent Director<BR>3. Iti Goyal - Director<BR>4. Prakash Matai - Executive Director<BR>5. Suresh Chander Sharma - Independent Director<BR>6. Radhey Shyam - Independent Director<BR><BR>These members play various roles within the company's leadership structure.

View full answer

Who are the top shareholders of the Jindal Poly Inve?

06-Jun-2025

The top shareholders of Jindal Poly Inve include the Futuristic Trust, holding 50.99%, followed by individual investors with 20.22%. Notable public shareholder Rajendra Prasad Bubna holds 1.9%, while foreign institutional investors have a minor stake of 0.12%, and there are no mutual funds invested in the company.

The top shareholders of Jindal Poly Inve include the promoters, with the Futuristic Trust (formerly known as SSJ Trust), managed by Shyam Sunder Jindal and Subhadra Jindal, holding the largest stake at 50.99%. Additionally, individual investors collectively hold 20.22% of the shares. Among public shareholders, Rajendra Prasad Bubna is the most significant, with a holding of 1.9%. The company also has a small presence of foreign institutional investors (FIIs), with two FIIs holding a total of 0.12%. There are no mutual funds currently invested in the company.

View full answer

What does Jindal Poly Inve do?

06-Jun-2025

Jindal Poly Investment and Finance Company Ltd is a micro-cap NBFC primarily focused on holding investments in group companies. As of March 2025, it reported net sales of 8 Cr and a net profit of 67 Cr.

Overview: <BR>Jindal Poly Investment and Finance Company Ltd is engaged in holding investments mainly in group companies and operates within the Non Banking Financial Company (NBFC) sector, classified as a micro-cap entity.<BR><BR>History: <BR>The company was incorporated on July 11, 2012, in Kanpur. It became a subsidiary of Jindal India Powertech Limited on March 24, 2017. The latest quarterly results reported net sales and net profit for the period ending March 2025.<BR><BR>Financial Snapshot: <BR>Net Sales: 8 Cr (Quarterly Results - Mar 2025) <BR>Net Profit: 67 Cr (Quarterly Results - Mar 2025) <BR>Market Cap: Rs 874 Cr (Micro Cap)<BR><BR>Key Metrics: <BR>P/E: 3.00 <BR>Industry P/E: 23 <BR>Dividend Yield: 0.00% <BR>Debt-Equity: 0.02 <BR>Return on Equity: 19.41% <BR>Price to Book: 0.59<BR><BR>Contact Details: <BR>Address: 19th K M Hapur-Bulundshahr Rd, PO Gulaothi Bulandshahr Uttar Pradesh : 245408 <BR>Email: secretarialinvestments@jindalgroup.com <BR>Website: http://www.jpifcl.com

View full answer

Has Jindal Poly Inve declared dividend?

06-Jun-2025

No Dividend History Available

Who are the peers of the Jindal Poly Inve?

03-Jun-2025

Jindal Poly Inve's peers include Bajaj Finance, Jio Financial, Cholaman.Inv.&Fn, Shriram Finance, Muthoot Finance, VLS Finance, Prime Securities, and Last Mile Enter. Jindal Poly Inve has below-average management risk and a 1-year return of 17.91%, while Bajaj Finance leads with a 30.41% return.

Peers: The peers of Jindal Poly Inve are Bajaj Finance, Jio Financial, Cholaman.Inv.&Fn, Shriram Finance, Muthoot Finance, BEML Land Assets, VLS Finance, Prime Securities, Last Mile Enter.<BR><BR>Quality Snapshot: Excellent management risk is observed at Bajaj Finance, Cholaman.Inv.&Fn, and Muthoot Finance, while Average management risk is found at Jio Financial and Prime Securities. Good management risk is noted at Shriram Finance, while Below Average management risk is present at Jindal Poly Inve, VLS Finance, and Last Mile Enter. Excellent growth is seen at Jio Financial and the rest have varying ratings, with Good growth at Bajaj Finance, Cholaman.Inv.&Fn, Shriram Finance, Jindal Poly Inve, and VLS Finance, while Average growth is noted at Muthoot Finance, Prime Securities, and Last Mile Enter. Capital Structure is Excellent for Bajaj Finance, Jio Financial, Shriram Finance, Muthoot Finance, Jindal Poly Inve, VLS Finance, and Prime Securities, while Good is noted at Cholaman.Inv.&Fn.<BR><BR>Return Snapshot: The peer with the highest 1-year return is Bajaj Finance at 30.41%, while the lowest is Last Mile Enter. at -74.29%. Jindal Poly Inve's 1-year return of 17.91% is higher than that of Last Mile Enter. Peers with negative six-month returns include VLS Finance, Last Mile Enter., and BEML Land Assets.

View full answer
iScoreScore
Click here to find our call on this stock
Strong Sell
Sell
Hold
Buy
Strong Buy

Dashboard

1

Strong Long Term Fundamental Strength with an average Return on Equity (ROE) of 22.18%

 
2

Healthy long term growth as Net Sales has grown by an annual rate of 300.98% and Operating profit at 114.33%

 
3

With a growth in Operating Profit of 510.88%, the company declared Very Positive results in Mar 26

4

With ROE of 53.4, it has a Attractive valuation with a 0.7 Price to Book Value

5

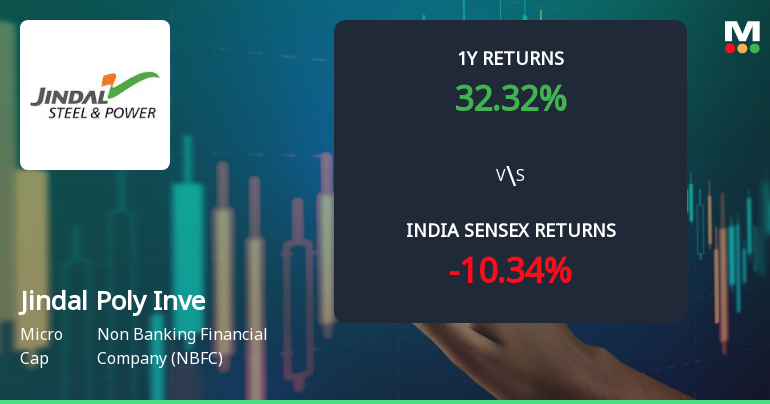
Market Beating Performance

stock-summaryMojo Parameters

Mojo Parameters

Loading Valuation Snapshot...

Stock DNA

stock-summary
Industry

Non Banking Financial Company (NBFC)

stock-summary
Market cap

INR 1,159 Cr (Micro Cap)

stock-summary
P/E

1.00

stock-summary
Industry P/E

20

stock-summary
Dividend Yield

0.00%

stock-summary
Debt Equity

0.01

stock-summary
Return on Equity

53.43%

stock-summary
Price to Book

0.74

Revenue and Profits:
Net Sales:
47 Cr
(Quarterly Results - Mar 2026)
Net Profit:
35 Cr
stock-summaryTotal Returns
Total Returns (Price + Dividend) stock-summary
Dividend Yield (0%)
TimePeriod
Price Return
Dividend Return
Total Return
3 Months
-22.18%
0%
-22.18%
6 Months
2.05%
0%
2.05%
1 Year
32.3%
0%
32.3%
2 Years
42.79%
0%
42.79%
3 Years
84.43%
0%
84.43%
4 Years
303.51%
0%
303.51%
5 Years
3139.35%
0%
3139.35%

Jindal Poly Inve for the last several years.

Risk Adjusted Returns v/s stock-summary
Returns Beta
Icon
Beta has not been calculated since enough price history is not available
stock-summaryNews & Corporate Actions

News

Announcements stock-summary

Announcement under Regulation 30 (LODR)-Newspaper Publication

01-Jun-2026 | Source : BSE

Intimation under Regulation 30 and Regulation 47 of the Securities and Exchange Board of India (Listing Obligations and Disclosure Requirements) Regulations 2015 (SEBI Listing Regulations) - Newspaper clippings of the published financial results

Board Meeting Outcome for Outcome Of The Board Meeting For The Quarter And Financial Year Ended March 31 2026

30-May-2026 | Source : BSE

Outcome of the Board Meeting for the quarter and financial year ended March 31 2026

Compliances-Reg.24(A)-Annual Secretarial Compliance

30-May-2026 | Source : BSE

Annual Secretarial Compliance Report for the FY 2025-26

Corporate Actions stock-summary

stock-summary
BOARD MEETING

No Upcoming Board Meetings

stock-summary
DIVIDEND

No Dividend history available

stock-summary
SPLITS

No Splits history available

stock-summary
BONUS

No Bonus history available

stock-summary
RIGHTS

No Rights history available

stock-summaryKey Factors

Quality key factors stock-summary

Factor
Value
Sales Growth (5y)
300.98%
EBIT Growth (5y)
114.33%
Net Debt to Equity (avg)
0.01
Institutional Holding
0.63%
ROE (avg)
22.18%

Valuation key factors

Factor
Value
P/E Ratio
1
Industry P/E
20
Price to Book Value
0.74
EV to EBIT
1.16
EV to EBITDA
1.16
EV to Capital Employed
0.74
EV to Sales
1.16
PEG Ratio
0.01
Dividend Yield
NA
ROCE (Latest)
63.63%
ROE (Latest)
53.43%

Technicals key factors

Indicator
Weekly
Monthly
MACD
Mildly Bearish
Bullish
RSI
No Signal
No Signal
Bollinger Bands
Bullish
Bullish
Moving Averages
Bullish (Daily)
KST
Mildly Bearish
Bullish
Dow Theory
Mildly Bullish
Mildly Bearish
OBV
No Trend
Mildly Bullish
stock-summary Technical Indicator Scale: Bearish, Mildly Bearish, Sideways, Mildly Bullish, Bullish  Turned 
stock-summaryShareholding
Shareholding Snapshot : Mar 2026stock-summary
Shareholding Compare (%holding) stock-summary
Majority shareholders

Promoters

Pledged Promoter Holdings

None

Mutual Funds

Held by 0 Schemes

FIIs

Held by 6 FIIs (0.19%)

Promoter with highest holding

Futuristic Trust(formerly Known As Ssj Trust) (50.99%)

Highest Public shareholder

Anita Bubna . (1.94%)

Individual Investors Holdings

17.99%

stock-summaryFinancial
[
  {
    "link": "quarterly",
    "btn_text": "All Quarterly Results",
    "header": "Quarterly Results Snapshot (Consolidated) - Mar'26 - YoY",
    "rhs": [
      {
        "prefix": "Net Sales ",
        "suffix": "YoY Growth in quarter ended Mar 2026 is 503.83% vs -43.18% in Mar 2025",
        "dir": 1
      },
      {
        "prefix": "Consolidated Net Profit ",
        "suffix": "YoY Growth in quarter ended Mar 2026 is -47.25% vs -32.33% in Mar 2025",
        "dir": -1
      }
    ],
    "table": {
      "header": [
        "Mar'26",
        "Mar'25",
        "Change(%)"
      ],
      "body": [
        {
          "field": "Net Sales",
          "val1": "47.28",
          "val2": "7.83",
          "chgp": "503.83%",
          "chgp_class": "positive"
        },
        {
          "field": "Operating Profit (PBDIT) excl Other Income",
          "val1": "47.15",
          "val2": "7.72",
          "chgp": "510.75%",
          "chgp_class": "positive"
        },
        {
          "field": "Interest",
          "val1": "0.32",
          "val2": "0.37",
          "chgp": "-13.51%",
          "chgp_class": "positive"
        },
        {
          "field": "Exceptional Items",
          "val1": "0.00",
          "val2": "0.00",
          "chgp": "",
          "chgp_class": "neutral"
        },
        {
          "field": "Consolidate Net Profit",
          "val1": "35.16",
          "val2": "66.65",
          "chgp": "-47.25%",
          "chgp_class": "negative"
        },
        {
          "field": "Operating Profit Margin (Excl OI)",
          "val1": "99.73%",
          "val2": "98.60%",
          "chgp": "1.13%",
          "chgp_class": "positive"
        }
      ]
    }
  },
  {
    "link": "half-yearly",
    "btn_text": "All Half Yearly Results",
    "header": "Half Yearly Results Snapshot (Consolidated) - Sep'25",
    "rhs": [
      {
        "prefix": "Net Sales ",
        "suffix": " Growth in half year ended Sep 2025 is 70.98% vs 8.29% in Sep 2024",
        "dir": 1
      },
      {
        "prefix": "Consolidated Net Profit ",
        "suffix": " Growth in half year ended Sep 2025 is -38.54% vs 103.84% in Sep 2024",
        "dir": -1
      }
    ],
    "table": {
      "header": [
        "Sep'25",
        "Sep'24",
        "Change(%)"
      ],
      "body": [
        {
          "field": "Net Sales",
          "val1": "27.46",
          "val2": "16.06",
          "chgp": "70.98%",
          "chgp_class": "positive"
        },
        {
          "field": "Operating Profit (PBDIT) excl Other Income",
          "val1": "27.28",
          "val2": "15.88",
          "chgp": "71.79%",
          "chgp_class": "positive"
        },
        {
          "field": "Interest",
          "val1": "0.74",
          "val2": "0.74",
          "chgp": "",
          "chgp_class": "neutral"
        },
        {
          "field": "Exceptional Items",
          "val1": "0.00",
          "val2": "0.00",
          "chgp": "",
          "chgp_class": "neutral"
        },
        {
          "field": "Consolidate Net Profit",
          "val1": "120.30",
          "val2": "195.75",
          "chgp": "-38.54%",
          "chgp_class": "negative"
        },
        {
          "field": "Operating Profit Margin (Excl OI)",
          "val1": "99.34%",
          "val2": "98.88%",
          "chgp": "0.46%",
          "chgp_class": "positive"
        }
      ]
    }
  },
  {
    "link": "nine-monthly",
    "btn_text": "All Nine Monthly Results",
    "header": "Nine Monthly Results Snapshot (Consolidated) - Dec'25",
    "rhs": [
      {
        "prefix": "Net Sales ",
        "suffix": "YoY Growth in nine months ended Dec 2025 is 4,046.10% vs 7.14% in Dec 2024",
        "dir": 1
      },
      {
        "prefix": "Consolidated Net Profit ",
        "suffix": "YoY Growth in nine months ended Dec 2025 is 258.82% vs 16.29% in Dec 2024",
        "dir": 1
      }
    ],
    "table": {
      "header": [
        "Dec'25",
        "Dec'24",
        "Change(%)"
      ],
      "body": [
        {
          "field": "Net Sales",
          "val1": "989.26",
          "val2": "23.86",
          "chgp": "4,046.10%",
          "chgp_class": "positive"
        },
        {
          "field": "Operating Profit (PBDIT) excl Other Income",
          "val1": "988.98",
          "val2": "23.59",
          "chgp": "4,092.37%",
          "chgp_class": "positive"
        },
        {
          "field": "Interest",
          "val1": "1.06",
          "val2": "1.12",
          "chgp": "-5.36%",
          "chgp_class": "positive"
        },
        {
          "field": "Exceptional Items",
          "val1": "0.00",
          "val2": "0.00",
          "chgp": "",
          "chgp_class": "neutral"
        },
        {
          "field": "Consolidate Net Profit",
          "val1": "822.35",
          "val2": "229.18",
          "chgp": "258.82%",
          "chgp_class": "positive"
        },
        {
          "field": "Operating Profit Margin (Excl OI)",
          "val1": "99.97%",
          "val2": "98.87%",
          "chgp": "1.10%",
          "chgp_class": "positive"
        }
      ]
    }
  },
  {
    "link": "annual",
    "btn_text": "All Annual Results",
    "header": "Annual Results Snapshot (Consolidated) - Mar'26",
    "rhs": [
      {
        "prefix": "Net Sales ",
        "suffix": "YoY Growth in year ended Mar 2026 is 3,170.87% vs -12.09% in Mar 2025",
        "dir": 1
      },
      {
        "prefix": "Consolidated Net Profit ",
        "suffix": "YoY Growth in year ended Mar 2026 is 189.86% vs 0.09% in Mar 2025",
        "dir": 1
      }
    ],
    "table": {
      "header": [
        "Mar'26",
        "Mar'25",
        "Change(%)"
      ],
      "body": [
        {
          "field": "Net Sales",
          "val1": "1,036.54",
          "val2": "31.69",
          "chgp": "3,170.87%",
          "chgp_class": "positive"
        },
        {
          "field": "Operating Profit (PBDIT) excl Other Income",
          "val1": "1,036.13",
          "val2": "31.31",
          "chgp": "3,209.26%",
          "chgp_class": "positive"
        },
        {
          "field": "Interest",
          "val1": "1.38",
          "val2": "1.49",
          "chgp": "-7.38%",
          "chgp_class": "positive"
        },
        {
          "field": "Exceptional Items",
          "val1": "0.00",
          "val2": "0.00",
          "chgp": "",
          "chgp_class": "neutral"
        },
        {
          "field": "Consolidate Net Profit",
          "val1": "857.51",
          "val2": "295.84",
          "chgp": "189.86%",
          "chgp_class": "positive"
        },
        {
          "field": "Operating Profit Margin (Excl OI)",
          "val1": "99.96%",
          "val2": "98.80%",
          "chgp": "1.16%",
          "chgp_class": "positive"
        }
      ]
    }
  }
]

Quarterly Results Snapshot (Consolidated) - Mar'26 - YoYstock-summary

Mar'26
Mar'25
Change(%)
Net Sales
47.28
7.83
503.83%
Operating Profit (PBDIT) excl Other Income
47.15
7.72
510.75%
Interest
0.32
0.37
-13.51%
Exceptional Items
0.00
0.00
Consolidate Net Profit
35.16
66.65
-47.25%
Operating Profit Margin (Excl OI)
99.73%
98.60%
1.13%
Values in Rs Cr.
Direction Arrows
Net Sales

YoY Growth in quarter ended Mar 2026 is 503.83% vs -43.18% in Mar 2025

Direction Arrows
Consolidated Net Profit

YoY Growth in quarter ended Mar 2026 is -47.25% vs -32.33% in Mar 2025

Half Yearly Results Snapshot (Consolidated) - Sep'25stock-summary

Sep'25
Sep'24
Change(%)
Net Sales
27.46
16.06
70.98%
Operating Profit (PBDIT) excl Other Income
27.28
15.88
71.79%
Interest
0.74
0.74
Exceptional Items
0.00
0.00
Consolidate Net Profit
120.30
195.75
-38.54%
Operating Profit Margin (Excl OI)
99.34%
98.88%
0.46%
Values in Rs Cr.
Direction Arrows
Net Sales

Growth in half year ended Sep 2025 is 70.98% vs 8.29% in Sep 2024

Direction Arrows
Consolidated Net Profit

Growth in half year ended Sep 2025 is -38.54% vs 103.84% in Sep 2024

Nine Monthly Results Snapshot (Consolidated) - Dec'25stock-summary

Dec'25
Dec'24
Change(%)
Net Sales
989.26
23.86
4,046.10%
Operating Profit (PBDIT) excl Other Income
988.98
23.59
4,092.37%
Interest
1.06
1.12
-5.36%
Exceptional Items
0.00
0.00
Consolidate Net Profit
822.35
229.18
258.82%
Operating Profit Margin (Excl OI)
99.97%
98.87%
1.10%
Values in Rs Cr.
Direction Arrows
Net Sales

YoY Growth in nine months ended Dec 2025 is 4,046.10% vs 7.14% in Dec 2024

Direction Arrows
Consolidated Net Profit

YoY Growth in nine months ended Dec 2025 is 258.82% vs 16.29% in Dec 2024

Annual Results Snapshot (Consolidated) - Mar'26stock-summary

Mar'26
Mar'25
Change(%)
Net Sales
1,036.54
31.69
3,170.87%
Operating Profit (PBDIT) excl Other Income
1,036.13
31.31
3,209.26%
Interest
1.38
1.49
-7.38%
Exceptional Items
0.00
0.00
Consolidate Net Profit
857.51
295.84
189.86%
Operating Profit Margin (Excl OI)
99.96%
98.80%
1.16%
Values in Rs Cr.
Direction Arrows
Net Sales

YoY Growth in year ended Mar 2026 is 3,170.87% vs -12.09% in Mar 2025

Direction Arrows
Consolidated Net Profit

YoY Growth in year ended Mar 2026 is 189.86% vs 0.09% in Mar 2025

stock-summaryCompany CV
About Jindal Poly Investment & Finance Company Ltd stock-summary
stock-summary
Jindal Poly Investment & Finance Company Ltd
Micro Cap
Non Banking Financial Company (NBFC)
Jindal Poly Investment and Finance Company Limited was incorporated on July 11, 2012 at Kanpur. The Company is engaged in the business activity of holding investments mainly in group Companies. The performance of the investments mainly relies on the economic developments and the performance of the investee companies- its profits. The Company's revenue depends on the movements in the value of the investee companies.
Company Coordinates stock-summary
Company Details
19th K M Hapur-Bulundshahr Rd, PO Gulaothi Bulandshahr Uttar Pradesh : 245408
stock-summary
Tel:
stock-summary
secretarialinvestments@jindalgroup.
Registrar Details
Karvy Computershare Pvt Ltd, Plot No 17-24 , Near Image Hospital,, Reliance Cybervilae,Vithalrao Nagar,, Madhapur, Hyderabad