
Compare Jindal Poly Inve with Similar Stocks
Dashboard
Strong Long Term Fundamental Strength with an average Return on Equity (ROE) of 22.18%
Healthy long term growth as Net Sales has grown by an annual rate of 300.98% and Operating profit at 114.33%
With a growth in Operating Profit of 510.88%, the company declared Very Positive results in Mar 26
With ROE of 53.4, it has a Attractive valuation with a 0.7 Price to Book Value
Market Beating Performance
Stock DNA
Non Banking Financial Company (NBFC)
INR 1,197 Cr (Micro Cap)
1.00
21
0.00%
0.01
53.43%
0.74
Total Returns (Price + Dividend) 
Jindal Poly Inve for the last several years.
Risk Adjusted Returns v/s
Returns Beta

News

Jindal Poly Investment & Finance Company Ltd is Rated Buy
Jindal Poly Investment & Finance Company Ltd is rated 'Buy' by MarketsMOJO, with this rating last updated on 13 April 2026. However, the analysis and financial metrics discussed here reflect the stock's current position as of 01 July 2026, providing investors with an up-to-date perspective on its performance and outlook.
Read full news article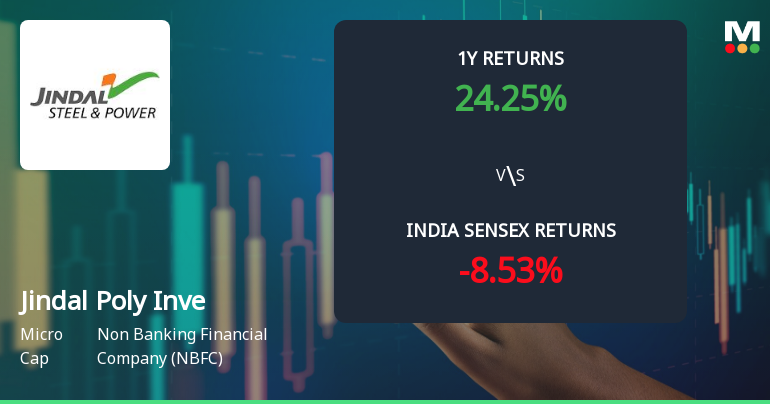
Jindal Poly Investment & Finance Company Ltd Shows Bullish Momentum Amid Technical Shifts
Jindal Poly Investment & Finance Company Ltd, a micro-cap player in the Non Banking Financial Company (NBFC) sector, has demonstrated a notable shift in price momentum and technical indicators, signalling a bullish trend despite mixed signals across various timeframes. The stock’s recent performance and technical upgrades suggest renewed investor interest and potential for further gains.
Read full news article
Jindal Poly Investment & Finance Company Ltd is Rated Buy
Jindal Poly Investment & Finance Company Ltd is rated 'Buy' by MarketsMOJO, with this rating last updated on 13 April 2026. However, the analysis and financial metrics discussed here reflect the stock's current position as of 20 June 2026, providing investors with the latest insights into its performance and outlook.
Read full news article Announcements
Jindal Poly Investment and Finance Company Limited - Other General Purpose
09-Dec-2019 | Source : NSEJindal Poly Investment and Finance Company Limited has informed the Exchange regarding disclosure of Related Party Transactions for the half year ended 30th September, 2019
Jindal Poly Investment and Finance Company Limited - Updates
16-Oct-2019 | Source : NSEJindal Poly Investment and Finance Company Limited has informed the Exchange regarding 'Certificate under Regulation 74(5) of the SEBl (Depositories and Participants) Regulations, 2018 for the Quarter Ended 30th September, 2019'.
Press Release
05-Sep-2019 | Source : NSE
| Jindal Poly Investment and Finance Company Limited has informed the Exchange regarding a press release dated September 05, 2019, titled "NOTICE OF 7th ANNUAL GENERAL MEETING". |
Corporate Actions

No Upcoming Board Meetings

No Dividend history available

No Splits history available

No Bonus history available

No Rights history available
Quality key factors
Valuation key factors
Technicals key factors
 Technical Indicator Scale: Bearish, Mildly Bearish, Sideways, Mildly Bullish, Bullish Turned
 Shareholding Snapshot : Mar 2026
Shareholding Compare (%holding)
Promoters
None
Held by 0 Schemes
Held by 6 FIIs (0.19%)
Futuristic Trust(formerly Known As Ssj Trust) (50.99%)
Anita Bubna . (1.94%)
17.99%
Quarterly Results Snapshot (Consolidated) - Mar'26 - YoY

YoY Growth in quarter ended Mar 2026 is 503.83% vs -43.18% in Mar 2025

YoY Growth in quarter ended Mar 2026 is -47.25% vs -32.33% in Mar 2025
Half Yearly Results Snapshot (Consolidated) - Sep'25
Growth in half year ended Sep 2025 is 70.98% vs 8.29% in Sep 2024
Growth in half year ended Sep 2025 is -38.54% vs 103.84% in Sep 2024
Nine Monthly Results Snapshot (Consolidated) - Dec'25
YoY Growth in nine months ended Dec 2025 is 4,046.10% vs 7.14% in Dec 2024
YoY Growth in nine months ended Dec 2025 is 258.82% vs 16.29% in Dec 2024
Annual Results Snapshot (Consolidated) - Mar'26
YoY Growth in year ended Mar 2026 is 3,170.87% vs -12.09% in Mar 2025
YoY Growth in year ended Mar 2026 is 189.86% vs 0.09% in Mar 2025
About Jindal Poly Investment & Finance Company Ltd

Company Coordinates


