
Compare Jinkushal Indus. with Similar Stocks
Total Returns (Price + Dividend) 
Jinkushal Indus. for the last several years.
Risk Adjusted Returns v/s
Returns Beta

News

Jinkushal Industries Downgraded to Sell Amid Deteriorating Fundamentals and Technicals
Jinkushal Industries Ltd, a micro-cap player in the automobile sector, has seen its investment rating downgraded from Hold to Sell as of 5 June 2026. This shift reflects deteriorations across key parameters including quality, valuation, financial trends, and technical indicators, signalling caution for investors amid flat financial performance and mixed market signals.
Read full news article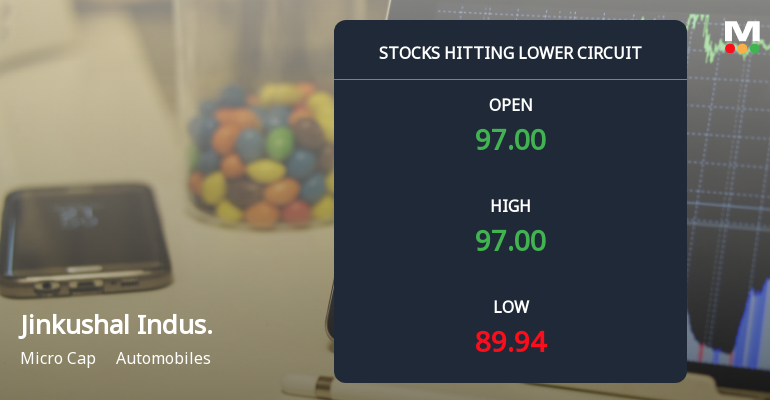
Jinkushal Industries Ltd Locks at Lower Circuit With 4.99% Loss — Sellers Queue, No Buyers in Sight
At Rs 89.42, sellers were still queuing — but there were no buyers willing to take the other side. Jinkushal Industries Ltd locked at its lower circuit of 4.99% on 2 Jun 2026, with unfilled sell orders and a frozen price, reflecting a day where supply overwhelmed demand to the point the exchange intervened.
Read full news article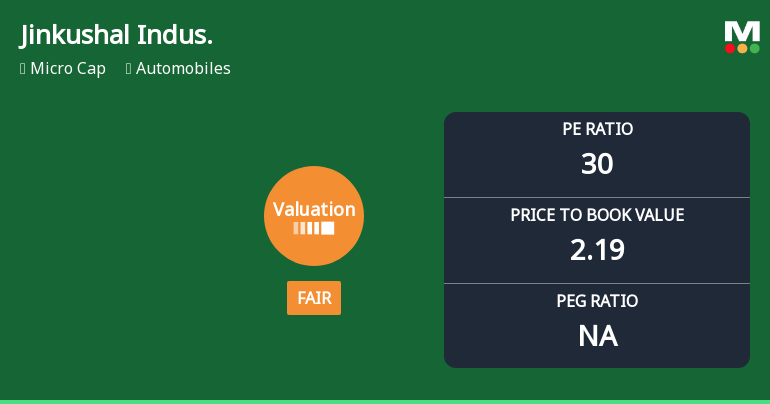
Jinkushal Industries Ltd Valuation Shifts Signal Changing Market Sentiment
Jinkushal Industries Ltd, a micro-cap player in the automobile sector, has witnessed a notable shift in its valuation parameters, reflecting evolving investor sentiment and market dynamics. The company’s price-to-earnings (P/E) ratio and price-to-book value (P/BV) have moved from attractive to fair territory, signalling a recalibration of its price attractiveness amid recent price gains and sectoral trends.
Read full news article Announcements
Announcement under Regulation 30 (LODR)-Analyst / Investor Meet - Intimation
08-Jun-2026 | Source : BSEPre- Intimation of schedule of Q4 FY26 Earnings Call
Announcement under Regulation 30 (LODR)-Earnings Call Transcript
08-Jun-2026 | Source : BSEPre Intimation of Schedule of Q4 FY 26 Earning Call
Announcement under Regulation 30 (LODR)-Newspaper Publication
31-May-2026 | Source : BSENewspaper Advertisment
Corporate Actions

No Upcoming Board Meetings

No Dividend history available

No Splits history available

No Bonus history available

No Rights history available
Quality key factors
Valuation key factors
Technicals key factors
 Technical Indicator Scale: Bearish, Mildly Bearish, Sideways, Mildly Bullish, Bullish Turned
 Shareholding Snapshot : Mar 2026
Shareholding Compare (%holding)
Promoters
None
Held by 0 Schemes
Held by 7 FIIs (0.82%)
Anil Kumar Jain (41.78%)
Royal Alpha Opportunity Fund (1.71%)
13.7%
Quarterly Results Snapshot (Standalone) - Mar'26 - QoQ

QoQ Growth in quarter ended Mar 2026 is 46.59% vs 73.79% in Dec 2025
QoQ Growth in quarter ended Mar 2026 is -76.98% vs 17.46% in Dec 2025
Half Yearly Results Snapshot (Standalone) - Sep'25
Not Applicable: The company has declared_date for only one period
Not Applicable: The company has declared_date for only one period
Nine Monthly Results Snapshot (Standalone) - Dec'25
Not Applicable: The company has declared_date for only one period
Not Applicable: The company has declared_date for only one period
Annual Results Snapshot (Standalone) - Mar'26

YoY Growth in year ended Mar 2026 is 47.92% vs -11.20% in Mar 2025
YoY Growth in year ended Mar 2026 is -22.64% vs -14.97% in Mar 2025
About Jinkushal Industries Ltd

Company Coordinates


