
Compare JK Paper with Similar Stocks
Dashboard
High Management Efficiency with a high ROCE of 16.12%
Company has a Debt to Equity ratio (avg) of 0.43 times
Flat results in Mar 26
With ROCE of 7.3, it has a Attractive valuation with a 1.1 Enterprise value to Capital Employed
Rising Promoter Confidence
Below par performance in long term as well as near term
With its market cap of Rs 6,301 cr, it is the biggest company in the sector and constitutes 26.34% of the entire sector
Stock DNA
Paper, Forest & Jute Products
INR 6,230 Cr (Small Cap)
22.00
17
1.34%
0.36
5.09%
1.14
Total Returns (Price + Dividend) 
Latest dividend: 5 per share ex-dividend date: Aug-18-2025
Risk Adjusted Returns v/s
Returns Beta

News

JK Paper Ltd Technical Momentum Shifts Amid Mixed Indicator Signals
JK Paper Ltd has experienced a subtle shift in its technical momentum, moving from a sideways trend to a mildly bullish stance, despite a complex mix of indicator signals. The stock’s recent performance, coupled with evolving technical parameters, suggests cautious optimism for investors navigating the Paper, Forest & Jute Products sector.
Read full news article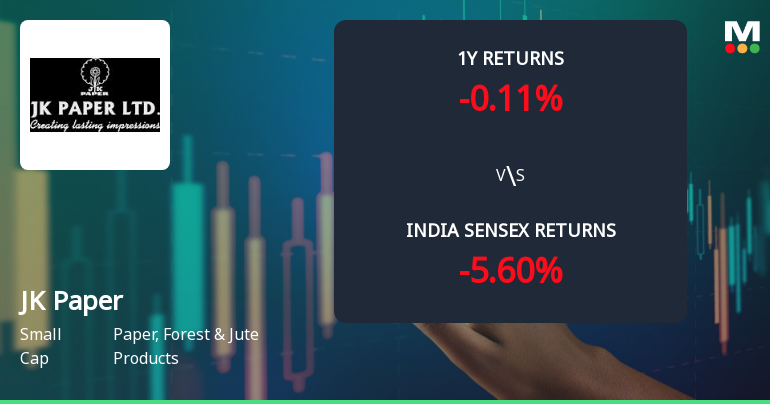
JK Paper Ltd Technical Momentum Shifts Amid Mixed Market Signals
JK Paper Ltd has experienced a notable shift in its technical momentum, transitioning from a mildly bullish stance to a sideways trend, reflecting mixed signals across key indicators such as MACD, RSI, and moving averages. This development comes amid a broader market context where the stock has underperformed the Sensex over recent months, prompting a downgrade in its Mojo Grade from Buy to Hold.
Read full news article
JK Paper Ltd is Rated Hold by MarketsMOJO
JK Paper Ltd is rated 'Hold' by MarketsMOJO, with this rating last updated on 20 May 2026. However, the analysis and financial metrics discussed here reflect the company’s current position as of 14 June 2026, providing investors with an up-to-date view of the stock’s fundamentals, valuation, financial trends, and technical outlook.
Read full news article Announcements
Announcement under Regulation 30 (LODR)-Newspaper Publication
19-Jun-2026 | Source : BSENewspaper Publication
Announcement under Regulation 30 (LODR)-Updates on Acquisition
11-Jun-2026 | Source : BSEAcquisition Update- Borkar packaging Private Limited
Compliances-Reg.24(A)-Annual Secretarial Compliance
20-May-2026 | Source : BSEAnnual Secretarial Compliance Report for the financial year ended 31st March 2026
Corporate Actions

No Upcoming Board Meetings

JK Paper Ltd has declared 50% dividend, ex-date: 18 Aug 25

No Splits history available

No Bonus history available

JK Paper Ltd has announced 3:4 rights issue, ex-date: 26 Jul 11
Quality key factors
Valuation key factors
Technicals key factors
 Technical Indicator Scale: Bearish, Mildly Bearish, Sideways, Mildly Bullish, Bullish Turned
 Shareholding Snapshot : Mar 2026
Shareholding Compare (%holding)
Promoters
None
Held by 9 Schemes (5.44%)
Held by 137 FIIs (11.59%)
Bengal & Assam Company Ltd (43.92%)
Pradip Kumar Khaitan Jointly With Shreekant Somany (trustees, Jk Paper Employees' Welfare Trust) (4.65%)
16.67%
Quarterly Results Snapshot (Consolidated) - Mar'26 - YoY

YoY Growth in quarter ended Mar 2026 is 17.23% vs -2.42% in Mar 2025
YoY Growth in quarter ended Mar 2026 is 35.76% vs -75.42% in Mar 2025
Half Yearly Results Snapshot (Consolidated) - Sep'25

Growth in half year ended Sep 2025 is 0.77% vs 5.01% in Sep 2024
Growth in half year ended Sep 2025 is -41.85% vs -56.10% in Sep 2024
Nine Monthly Results Snapshot (Consolidated) - Dec'25
YoY Growth in nine months ended Dec 2025 is 2.21% vs 1.78% in Dec 2024
YoY Growth in nine months ended Dec 2025 is -46.93% vs -60.57% in Dec 2024
Annual Results Snapshot (Consolidated) - Mar'26
YoY Growth in year ended Mar 2026 is 6.21% vs 0.05% in Mar 2025
YoY Growth in year ended Mar 2026 is -34.97% vs -63.56% in Mar 2025
About JK Paper Ltd

Company Coordinates


