
Compare JMG Corporation with Similar Stocks
Dashboard
With a Operating Losses, the company has a Weak Long Term Fundamental Strength
- Company's ability to service its debt is weak with a poor EBIT to Interest (avg) ratio of -0.70
- The company has reported losses. Due to this company has reported negative ROCE
Flat results in Dec 25
Risky - Negative EBITDA
Stock DNA
Plastic Products - Industrial
INR 15 Cr (Micro Cap)
NA (Loss Making)
15
0.00%
0.02
-3.19%
2.05
Total Returns (Price + Dividend) 
JMG Corporation for the last several years.
Risk Adjusted Returns v/s
Returns Beta

News
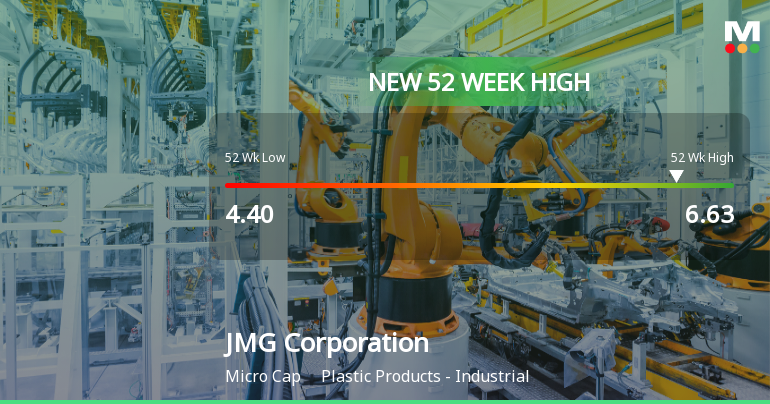
JMG Corporation Ltd Hits New 52-Week High at Rs.6.63
JMG Corporation Ltd, a player in the Plastic Products - Industrial sector, reached a significant milestone today by hitting a new 52-week high of Rs.6.63. This achievement marks a notable rally for the micro-cap stock, reflecting sustained momentum amid a mixed market environment.
Read full news article Announcements
Closure of Trading Window
30-Mar-2026 | Source : BSEDear Sir/Madam It may please be noted that in compliance with the SEBI (Prohibition to Insider Trading) Regulations 2015 as amended by the SEBI (Prohibition of Insider Trading) (Amendment) Regulations 2018 read with clarification given by BSE Circular Ref No.: LIST/COMP/01/2019-20 dated 02.04.2019 read with Companys Code of Conduct for prevention of Insider Trading the trading window of the company has been kept closed for designated person from Wednesday the 01st April 2026 till the end of 48 hours after the declaration of Audited financial results of the company for the quarter ended on 31st March 2026.
Announcement under Regulation 30 (LODR)-Open Offer - Updates
28-Mar-2026 | Source : BSEIn relation to the captioned subject we are enclosing herewith the Post Offer Advertisement dated Thursday March 26 2026 published on Friday March 27 2026 pursuant to Regulation 18(12) of the SEBI (Substantial Acquisition of Shares and Takeovers) Regulations 2011 in the following newspapers: 1- Financial Express: English 2- Jansatta : Hindi 3- Pratahkal: Marathi
Post Offer Advertisement
27-Mar-2026 | Source : BSESrujan Alpha Capital Advisors LLP (Manager to the Offer) has submitted to BSE a copy of Post Offer Advertisement under Regulation 18(12) of SEBI (SAST) Regulations 2011 as amended for the attention of the Public Shareholders of JMG Corporation Ltd.
Corporate Actions

No Upcoming Board Meetings

No Dividend history available

No Splits history available

No Bonus history available

No Rights history available
Quality key factors
Valuation key factors
Technicals key factors
 Technical Indicator Scale: Bearish, Mildly Bearish, Sideways, Mildly Bullish, Bullish Turned
 Shareholding Snapshot : Dec 2025
Shareholding Compare (%holding)
Non Institution
None
Held by 0 Schemes
Held by 0 FIIs
Atul Kumar Mishra (0.0%)
Jmg Corporation Ltd Spa Escrow Account-operated By-srujan Alpha Capital Advisors Llp (36.62%)
47.22%
Quarterly Results Snapshot (Standalone) - Dec'25 - QoQ

QoQ Growth in quarter ended Dec 2025 is 100.00% vs -52.17% in Sep 2025
QoQ Growth in quarter ended Dec 2025 is 76.32% vs -5.56% in Sep 2025
Half Yearly Results Snapshot (Standalone) - Sep'25
Growth in half year ended Sep 2025 is 325.00% vs -66.67% in Sep 2024
Growth in half year ended Sep 2025 is -124.24% vs -1,550.00% in Sep 2024
Nine Monthly Results Snapshot (Standalone) - Dec'25
YoY Growth in nine months ended Dec 2025 is 180.00% vs -54.55% in Dec 2024
YoY Growth in nine months ended Dec 2025 is -59.62% vs -620.00% in Dec 2024
Annual Results Snapshot (Standalone) - Mar'25
YoY Growth in year ended Mar 2025 is 45.16% vs -82.87% in Mar 2024

YoY Growth in year ended Mar 2025 is -52.94% vs 153.12% in Mar 2024
About JMG Corporation Ltd

Company Coordinates


