
Compare John Cockerill with Similar Stocks
Dashboard
Company has a Debt to Equity ratio (avg) of 0 times
Poor long term growth as Net Sales has grown by an annual rate of % over the last 5 years
With a growth in Net Profit of 1569.05%, the company declared Very Positive results in Mar 26
Risky - Negative EBITDA
Despite the size of the company, domestic mutual funds hold only 0% of the company
Stock DNA
Industrial Manufacturing
INR 5,238 Cr (Small Cap)
175.00
37
0.07%
0.00
0.00%
0.00
Total Returns (Price + Dividend) 
Latest dividend: 7 per share ex-dividend date: Mar-06-2026
Risk Adjusted Returns v/s
Returns Beta

News

John Cockerill India Ltd Locks at Upper Circuit With 8.07% Gain — Buyers Queue, Sellers Absent
At Rs 10,871.5, the buying was done — not because demand dried up, but because the exchange wouldn't let the stock go any higher. John Cockerill India Ltd locked at its upper circuit of 8.07% on 10 Jun 2026, with buyers queuing and no sellers willing to part with shares.
Read full news article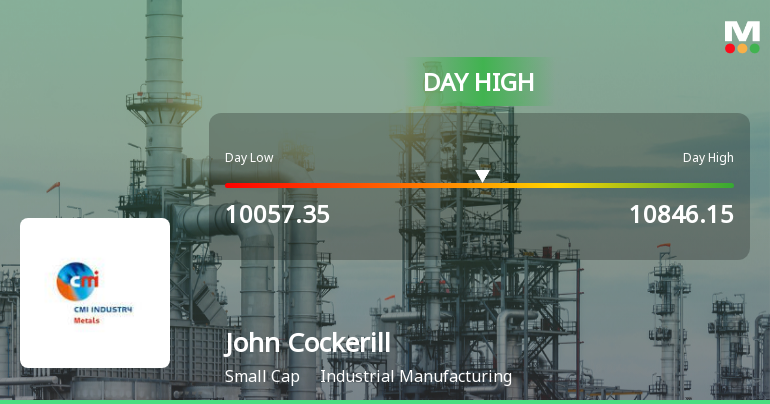
John Cockerill India Ltd Surges 7.58% to Day's High of Rs 10846.15 — Outperforms Sector by 6.94 Percentage Points
The Sensex rose 0.67% on 10 Jun 2026, but John Cockerill India Ltd outpaced the broader market with a 7.58% gain, touching a new 52-week and all-time high of Rs 10,846.15. This 6.94 percentage-point outperformance over its Industrial Manufacturing sector peers highlights a distinctly stock-specific rally rather than a market-wide lift.
Read full news article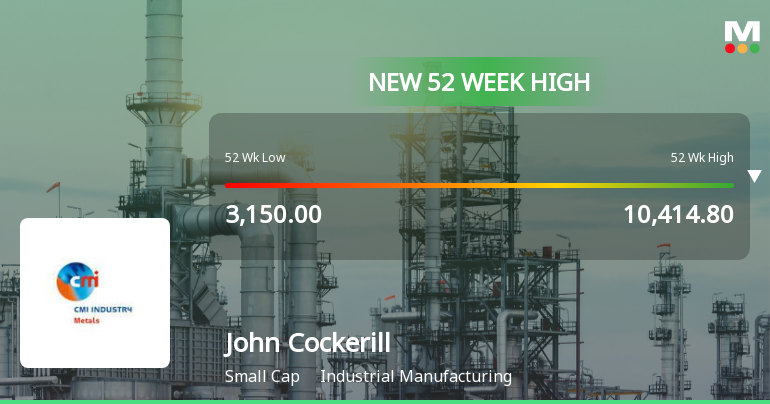
Broad-Based Technical Strength Lifts John Cockerill India Ltd to 52-Week High of Rs 10414.8
Surging to an all-time high of Rs 10,414.8 on 10 Jun 2026, John Cockerill India Ltd has demonstrated remarkable price momentum, outpacing its sector and the broader market with a 184.15% gain over the past year. This milestone reflects a confluence of bullish technical indicators and sustained upward momentum that has propelled the stock well beyond its 52-week low of Rs 3,150.
Read full news article Announcements
Reg. 34 (1) Annual Report.
05-Jun-2026 | Source : BSEIn continuation of our aforesaid intimation dated June 1 2026 we are submitting herewith the Corrigendum to the Notice of the 40th Annual General Meeting (AGM) of the Company scheduled to be held on Thursday June 25 2026 at 2:30 P.M. (IST) through hybrid mode i.e. physically at Navi Mumbai Marriott Hotel D-264 Thane-Belapur Road TTC Estate Turbhe MIDC Navi Mumbai Maharashtra - 400705 with the facility for participation through Video Conferencing (VC) / Other Audio-Visual Means (OAVM) and the Annual Report of the Company for the Financial Year ended December 31 2025.
Shareholder Meeting - AGM On June 25 2026
05-Jun-2026 | Source : BSEPlease find attached Corrigendum to the Notice of the 40th Annual General Meeting of the Company to be held on June 25 2026
Announcement Under Regulation 30 (LODR) - Corrigendum To The Notice Of The 40Th Annual General Meeting Of The Company To Be Held On June 25 2026 And Annual Report For The Financial Year Ended December 31 2025
05-Jun-2026 | Source : BSEPlease find attached Corrigendum to the Notice of the 40th Annual General Meeting of the Company to be held on June 25 2026 and Annual Report for the Financial Year ended December 31 2025.
Corporate Actions

No Upcoming Board Meetings

John Cockerill India Ltd has declared 70% dividend, ex-date: 06 Mar 26

No Splits history available

No Bonus history available

No Rights history available
Quality key factors
Valuation key factors
Technicals key factors
 Technical Indicator Scale: Bearish, Mildly Bearish, Sideways, Mildly Bullish, Bullish Turned
 Shareholding Snapshot : Mar 2026
Shareholding Compare (%holding)
Promoters
None
Held by 0 Schemes
Held by 1 FIIs (0.02%)
John Cockerill Sa (formerly Cockerill Maintenance And Ingenierie Sa) (70.33%)
Datta Mahendra Shah (1.56%)
23.6%
Quarterly Results Snapshot (Standalone) - Mar'26 - QoQ

QoQ Growth in quarter ended Mar 2026 is 95.98% vs 5.25% in Dec 2025
QoQ Growth in quarter ended Mar 2026 is 1,569.05% vs -95.29% in Dec 2025
Half Yearly Results Snapshot (Standalone) - Jun'25
Not Applicable: The company has declared_date for only one period
Not Applicable: The company has declared_date for only one period
Nine Monthly Results Snapshot (Standalone) - Sep'25
YoY Growth in nine months ended Sep 2025 is -19.24% vs -52.54% in Sep 2024
YoY Growth in nine months ended Sep 2025 is 352.94% vs -118.07% in Sep 2024
Annual Results Snapshot (Standalone) - Dec'25
Not Applicable: The company has declared_date for only one period
Not Applicable: The company has declared_date for only one period
About John Cockerill India Ltd

Company Coordinates


