
Dashboard
Negative results in Sep 25
- PAT(9M) At Rs 43.70 cr has Grown at -22.29%
- PBT LESS OI(Q) At Rs -53.81 cr has Fallen at -15.37%
- CASH AND CASH EQUIVALENTS(HY) Lowest at Rs 19.67 cr
With ROCE of 5.8, it has a Expensive valuation with a 6.6 Enterprise value to Capital Employed
32.32% of Promoter Shares are Pledged
Below par performance in long term as well as near term
Stock DNA
Electronics & Appliances
INR 4,030 Cr (Small Cap)
100.00
78
2.44%
0.34
8.46%
8.39
Total Returns (Price + Dividend) 
Latest dividend: 36 per share ex-dividend date: Jul-09-2025
Risk Adjusted Returns v/s
Returns Beta

News

Johnson Con. Hit Sees Revision in Market Evaluation Amidst Challenging Financials
Johnson Con. Hit has undergone a revision in its market evaluation reflecting a more cautious outlook from analysts, driven by recent financial results and market performance within the Electronics & Appliances sector.
Read More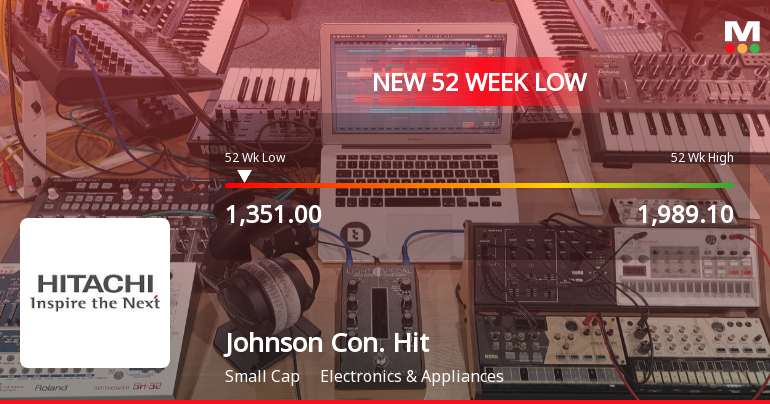
Johnson Controls-Hitachi Air Condition. India Hits 52-Week Low Amidst Prolonged Downtrend
Johnson Controls-Hitachi Air Condition. India has reached a fresh 52-week low of Rs. 1355.1, marking a significant milestone in its ongoing decline. The stock has experienced a sustained downward trajectory over the past week, reflecting a series of financial and market pressures that have influenced its performance.
Read More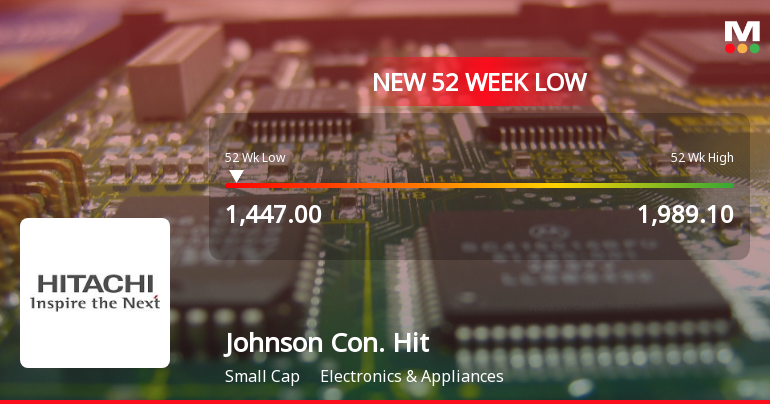
Johnson Controls-Hitachi Air Condition. India Falls to 52-Week Low of Rs.1447
Johnson Controls-Hitachi Air Condition. India has reached a new 52-week low of Rs.1447, marking a significant decline amid a broader market environment where the Sensex trades near its yearly highs. The stock has experienced a sustained downward trend over the past week, reflecting a series of financial and market factors impacting its valuation.
Read More Announcements
Disclosures under Reg. 29(2) of SEBI (SAST) Regulations 2011
10-Dec-2025 | Source : BSEThe Exchange has received the disclosure under Regulation 29(2) of SEBI (Substantial Acquisition of Shares & Takeovers) Regulations 2011 for Aditya Birla Sun Life Mutual Fund
Disclosures under Reg. 29(2) of SEBI (SAST) Regulations 2011
10-Dec-2025 | Source : BSEThe Exchange has received the disclosure under Regulation 29(2) of SEBI (Substantial Acquisition of Shares & Takeovers) Regulations 2011 for Robert Bosch GmbH
Post-Offer Advertisement
10-Dec-2025 | Source : BSEHSBC Securities and Capital Markets (India) Pvt. Ltd. (Manager to the Open Offer) has submitted to BSE a copy of Post-Offer Advertisement in accordance with Regulation 18(12) of the Securities and Exchange Board of India (Substantial Acquisition of Shares and Takeovers) Regulations 2011 as amended for the attention of the public shareholders of Johnson Controls-Hitachi Air Conditioning India Ltd (Target Company).
Corporate Actions

No Upcoming Board Meetings

Johnson Controls-Hitachi Air Condition. India Ltd has declared 360% dividend, ex-date: 09 Jul 25

No Splits history available

No Bonus history available

Johnson Controls-Hitachi Air Condition. India Ltd has announced 1:5 rights issue, ex-date: 05 Mar 13
Quality key factors
Valuation key factors
Technicals key factors
 Technical Indicator Scale: Bearish, Mildly Bearish, Sideways, Mildly Bullish, Bullish Turned
 Shareholding Snapshot : Sep 2025
Shareholding Compare (%holding)
Promoters
32.3212
Held by 10 Schemes (5.72%)
Held by 29 FIIs (1.03%)
Jchac India Holdco Limited (74.25%)
Aditya Birla Sun Life Trustee Private Limited A/c - Aditya Birla Sun Life Elss Tax Saver Fund (3.65%)
13.95%
Quarterly Results Snapshot (Standalone) - Sep'25 - YoY

YoY Growth in quarter ended Sep 2025 is 2.24% vs 41.45% in Sep 2024
YoY Growth in quarter ended Sep 2025 is -32.98% vs 46.72% in Sep 2024
Half Yearly Results Snapshot (Standalone) - Sep'25
Growth in half year ended Sep 2025 is -9.66% vs 64.31% in Sep 2024
Growth in half year ended Sep 2025 is -505.08% vs 106.26% in Sep 2024
Nine Monthly Results Snapshot (Standalone) - Dec'24

YoY Growth in nine months ended Dec 2024 is 59.03% vs -37.56% in Dec 2023
YoY Growth in nine months ended Dec 2024 is 102.22% vs -53.59% in Dec 2023
Annual Results Snapshot (Standalone) - Mar'25
YoY Growth in year ended Mar 2025 is 43.66% vs -19.53% in Mar 2024
YoY Growth in year ended Mar 2025 is 177.70% vs 7.83% in Mar 2024
About Johnson Controls-Hitachi Air Condition. India Ltd

Company Coordinates


