
Compare Jones Lang LaSalle, Inc. with Similar Stocks
Dashboard
Strong Long Term Fundamental Strength with an average Return on Equity (ROE) of 10.47%
The company has declared Positive results for the last 4 consecutive quarters
With ROE of 8.32%, it has a fair valuation with a 1.65 Price to Book Value
Market Beating performance in long term as well as near term
Total Returns (Price + Dividend) 
Jones Lang LaSalle, Inc. for the last several years.
Risk Adjusted Returns v/s
News

Jones Lang LaSalle Reports Strong Cash Flow Amid Rising Interest Expenses and Modest Profit Growth
Jones Lang LaSalle, Inc. has recently experienced a change in evaluation, reflecting its financial standing. The company reported strong operating cash flow of USD 910.7 million and a return on capital employed of 8.4%. However, rising interest expenses and limited growth in operating profit present challenges.
Read full news article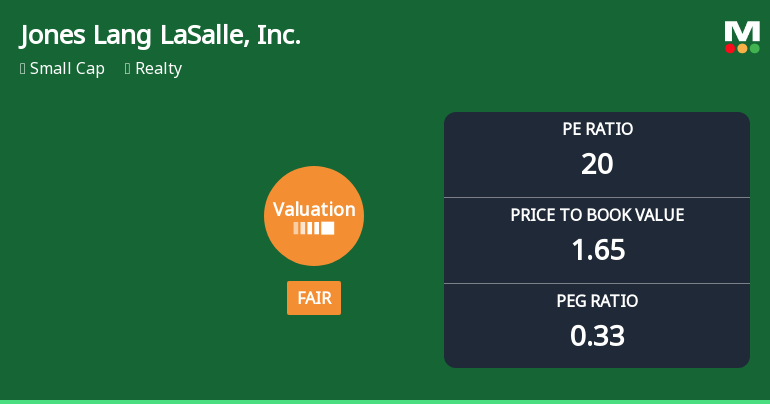
Jones Lang LaSalle, Inc. Experiences Revision in Its Stock Evaluation Metrics
Jones Lang LaSalle, Inc. has recently adjusted its valuation, with a P/E ratio of 20 and a price-to-book value of 1.65. Key metrics indicate operational efficiency, while its performance compared to peers shows a varied financial landscape. The stock price has seen slight fluctuations, with a 12.60% return over the past year.
Read full news article Announcements

Corporate Actions
Quality key factors
Valuation key factors
Technicals key factors
 Technical Indicator Scale: Bearish, Mildly Bearish, Sideways, Mildly Bullish, Bullish Turned
 Shareholding Snapshot : Sep 2025
Shareholding Compare (%holding)
Domestic Funds
Held in 123 Schemes (48.49%)
Held by 214 Foreign Institutions (23.4%)
Quarterly Results Snapshot (Consolidated) - Jun'25 - YoY

YoY Growth in quarter ended Jun 2025 is 11.04% vs 11.40% in Jun 2024
YoY Growth in quarter ended Jun 2025 is 30.77% vs 2,540.62% in Jun 2024
Annual Results Snapshot (Consolidated) - Dec'24

YoY Growth in year ended Dec 2024 is 12.87% vs -0.49% in Dec 2023
YoY Growth in year ended Dec 2024 is 196.37% vs -71.49% in Dec 2023
About Jones Lang LaSalle, Inc.

Company Coordinates


