
Compare JSL Industries with Similar Stocks
Stock DNA
Other Electrical Equipment
INR 100 Cr (Micro Cap)
31.00
44
0.00%
0.04
7.04%
2.26
Total Returns (Price + Dividend) 
JSL Industries for the last several years.
Risk Adjusted Returns v/s
Returns Beta

News
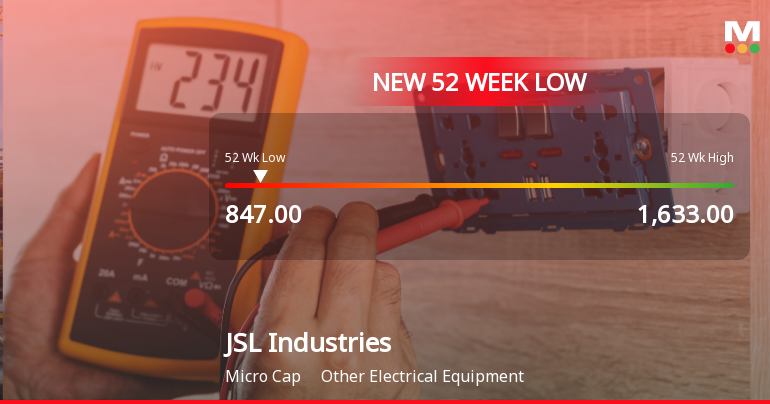
JSL Industries Ltd Falls to 52-Week Low of Rs 847 as Sell-Off Deepens
For the third consecutive session, JSL Industries Ltd has closed lower, culminating in a fresh 52-week low of Rs 847 on 9 Jul 2026. This decline comes despite a broader market rally, highlighting stock-specific pressures that have intensified recently.
Read full news article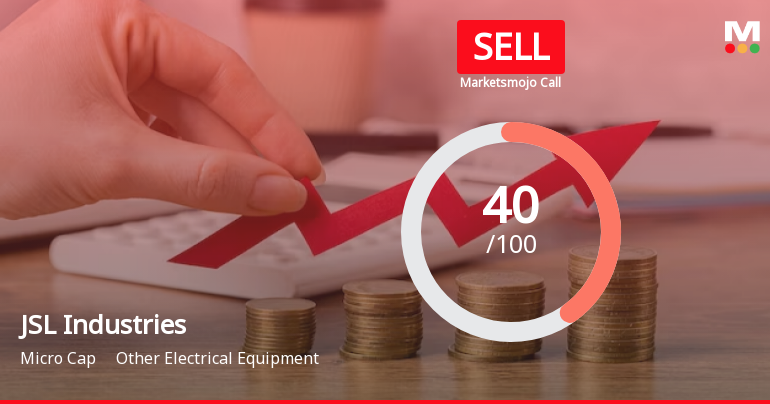
JSL Industries Ltd is Rated Sell
JSL Industries Ltd is rated 'Sell' by MarketsMOJO, with this rating last updated on 13 May 2026. While the rating was revised on that date, the analysis and financial metrics discussed here reflect the stock's current position as of 08 July 2026, providing investors with an up-to-date perspective on the company’s performance and outlook.
Read full news article
JSL Industries Ltd is Rated Sell
JSL Industries Ltd is rated 'Sell' by MarketsMOJO, with this rating last updated on 13 May 2026. However, the analysis and financial metrics discussed here reflect the stock's current position as of 27 June 2026, providing investors with an up-to-date view of the company’s performance and outlook.
Read full news article Announcements
Announcement under Regulation 30 (LODR)-Newspaper Publication
17-Jul-2026 | Source : BSEPublic Notice
Shareholder Meeting / Postal Ballot-Scrutinizers Report
08-Jul-2026 | Source : BSEVoting results of AGM dated 07.07.2026 and Scrutinizer Report
Shareholder Meeting / Postal Ballot-Outcome of AGM
07-Jul-2026 | Source : BSEOutcome of AGM
Corporate Actions

No Upcoming Board Meetings

No Dividend history available

No Splits history available

No Bonus history available

No Rights history available
Quality key factors
Valuation key factors
Technicals key factors
 Technical Indicator Scale: Bearish, Mildly Bearish, Sideways, Mildly Bullish, Bullish Turned
 Shareholding Snapshot : Jun 2026
Shareholding Compare (%holding)
Non Institution
None
Held by 0 Schemes
Held by 0 FIIs
Saatyaki Anant Amin (14.88%)
Minaxi Madhubhai Patel (21.87%)
45.5%
Quarterly Results Snapshot (Standalone) - Mar'26 - QoQ

QoQ Growth in quarter ended Mar 2026 is 25.65% vs 4.40% in Dec 2025
QoQ Growth in quarter ended Mar 2026 is 60.81% vs -22.92% in Dec 2025
Half Yearly Results Snapshot (Standalone) - Sep'25

Growth in half year ended Sep 2025 is -2.87% vs 7.71% in Sep 2024
Growth in half year ended Sep 2025 is -75.93% vs 17.71% in Sep 2024
Nine Monthly Results Snapshot (Standalone) - Dec'25
YoY Growth in nine months ended Dec 2025 is -2.44% vs 3.67% in Dec 2024
YoY Growth in nine months ended Dec 2025 is -68.37% vs 47.23% in Dec 2024
Annual Results Snapshot (Standalone) - Mar'26
YoY Growth in year ended Mar 2026 is 5.22% vs 4.44% in Mar 2025
YoY Growth in year ended Mar 2026 is -48.99% vs 4.71% in Mar 2025
About JSL Industries Ltd

Company Coordinates


