
Compare JSL Industries with Similar Stocks
Stock DNA
Other Electrical Equipment
INR 117 Cr (Micro Cap)
36.00
44
0.00%
0.04
7.04%
2.51
Total Returns (Price + Dividend) 
JSL Industries for the last several years.
Risk Adjusted Returns v/s
Returns Beta

News

JSL Industries Ltd is Rated Sell
JSL Industries Ltd is currently rated Sell by MarketsMOJO, with this rating last updated on 13 May 2026. While the rating change occurred on that date, the analysis and financial metrics presented here reflect the stock's current position as of 01 June 2026, providing investors with an up-to-date view of the company’s standing.
Read full news article
JSL Industries Ltd is Rated Sell
JSL Industries Ltd is rated 'Sell' by MarketsMOJO, with this rating last updated on 13 May 2026. However, the analysis and financial metrics discussed here reflect the stock's current position as of 21 May 2026, providing investors with the latest insights into the company’s performance and outlook.
Read full news article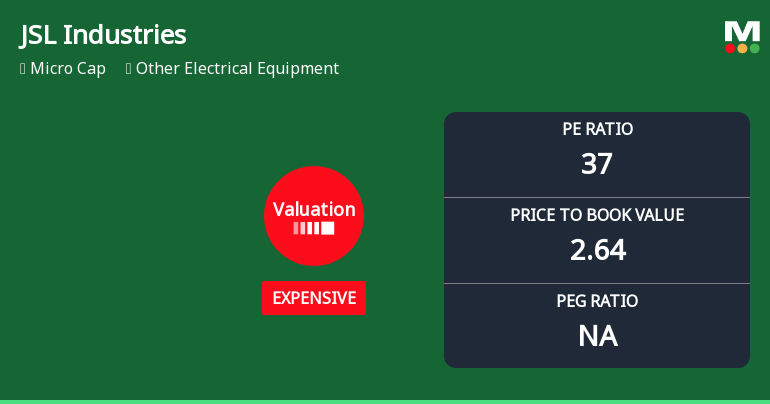
JSL Industries Ltd Valuation Shifts to Expensive Amid Mixed Returns
JSL Industries Ltd, a micro-cap player in the Other Electrical Equipment sector, has seen its valuation parameters shift notably, moving from fair to expensive territory. Despite a recent day gain of 2.40%, the stock’s elevated price-to-earnings (P/E) and price-to-book value (P/BV) ratios raise questions about its price attractiveness relative to historical averages and peer benchmarks.
Read full news article Announcements
Regulation 42 Of SEBI (Listing Obligations And Disclosure Requirements) Regulations 2015 Intimation Of Book Closure
08-Jun-2026 | Source : BSEBook closure from 01/07/2026 to 07/07/2026.
Reg. 34 (1) Annual Report.
08-Jun-2026 | Source : BSEAnnual Report 2025-26
Notice Of 60Th Annual General Meeting (AGM) Of The Company
08-Jun-2026 | Source : BSENotice of AGM and Letter providing web link of annual report reminder to update KYC Details by physcial and demat holders.
Corporate Actions

No Upcoming Board Meetings

No Dividend history available

No Splits history available

No Bonus history available

No Rights history available
Quality key factors
Valuation key factors
Technicals key factors
 Technical Indicator Scale: Bearish, Mildly Bearish, Sideways, Mildly Bullish, Bullish Turned
 Shareholding Snapshot : Mar 2026
Shareholding Compare (%holding)
Non Institution
None
Held by 0 Schemes
Held by 0 FIIs
Saatyaki Anant Amin (15.05%)
Minaxi Madhubhai Patel (21.87%)
45.37%
Quarterly Results Snapshot (Standalone) - Mar'26 - QoQ

QoQ Growth in quarter ended Mar 2026 is 25.65% vs 4.40% in Dec 2025
QoQ Growth in quarter ended Mar 2026 is 60.81% vs -22.92% in Dec 2025
Half Yearly Results Snapshot (Standalone) - Sep'25

Growth in half year ended Sep 2025 is -2.87% vs 7.71% in Sep 2024
Growth in half year ended Sep 2025 is -75.93% vs 17.71% in Sep 2024
Nine Monthly Results Snapshot (Standalone) - Dec'25
YoY Growth in nine months ended Dec 2025 is -2.44% vs 3.67% in Dec 2024
YoY Growth in nine months ended Dec 2025 is -68.37% vs 47.23% in Dec 2024
Annual Results Snapshot (Standalone) - Mar'26
YoY Growth in year ended Mar 2026 is 5.22% vs 4.44% in Mar 2025
YoY Growth in year ended Mar 2026 is -48.99% vs 4.71% in Mar 2025
About JSL Industries Ltd

Company Coordinates


