
Compare JTEKT India with Similar Stocks
Dashboard
Company has a Debt to Equity ratio (avg) of 0.09 times
Healthy long term growth as Operating profit has grown by an annual rate 47.32%
Positive results in Mar 26
With ROCE of 7, it has a Attractive valuation with a 2.8 Enterprise value to Capital Employed
Majority shareholders : Promoters
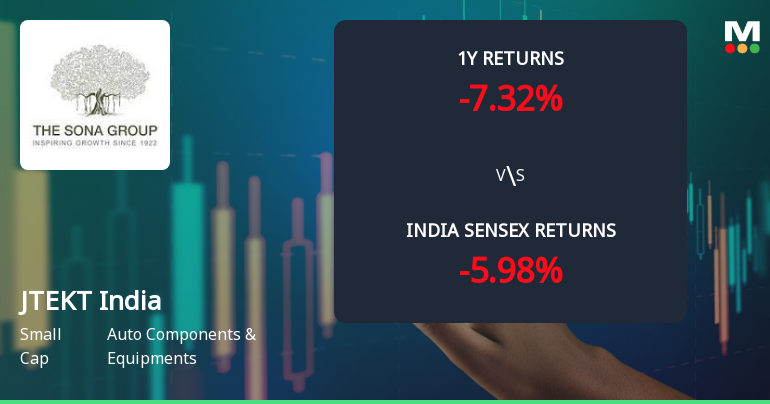
Consistent Underperformance against the benchmark over the last 3 years
Stock DNA
Auto Components & Equipments
INR 3,781 Cr (Small Cap)
49.00
37
0.50%
0.23
6.86%
3.24
Total Returns (Price + Dividend) 
Latest dividend: 0.6967213114754098 per share ex-dividend date: Aug-08-2025
Risk Adjusted Returns v/s
Returns Beta

News
JTEKT India Ltd Technical Momentum Shifts Amid Mixed Market Signals
JTEKT India Ltd has experienced a notable shift in its technical momentum, moving from a bearish stance to a mildly bearish outlook, reflecting a nuanced change in market sentiment. Despite a strong day gain of 5.02%, the stock’s technical indicators present a mixed picture, with some signals suggesting cautious optimism while others remain subdued. This article analyses the recent price momentum, key technical indicators, and the stock’s performance relative to the broader market.
Read full news article
JTEKT India Ltd Faces Bearish Momentum Amid Technical Indicator Shifts
JTEKT India Ltd has experienced a notable shift in its technical momentum, with key indicators signalling a transition from mildly bearish to a more pronounced bearish trend. Despite a recent upgrade in its Mojo Grade from Sell to Hold, the stock’s price action and technical parameters suggest caution for investors amid weakening momentum and persistent downward pressure.
Read full news article
JTEKT India Ltd is Rated Hold by MarketsMOJO
JTEKT India Ltd is rated 'Hold' by MarketsMOJO, with this rating last updated on 14 May 2026. While the rating change occurred on that date, the analysis and financial metrics discussed here reflect the stock's current position as of 08 June 2026, providing investors with an up-to-date view of the company’s fundamentals, returns, and market standing.
Read full news article Announcements
Jtekt India Limited - Other General Purpose
09-Dec-2019 | Source : NSEJtekt India Limited has informed the Exchange regarding Disclosure of related party transactions pursuant to Regulation 23(9) of Securities and Exchange Board of India (Listing Obligations and Disclosure Requirements) Regulations, 2015 (Listing Regulations).
Jtekt India Limited - Analysts/Institutional Investor Meet/Con. Call Updates
18-Nov-2019 | Source : NSEJtekt India Limited has informed the Exchange regarding Analysts/Institutional Investor Meet/Con. Call Updates
Investor Presentation
13-Aug-2019 | Source : NSE
| Jtekt India Limited has informed the Exchange regarding Investor Presentation |
Corporate Actions

No Upcoming Board Meetings

JTEKT India Ltd has declared 70% dividend, ex-date: 08 Aug 25

JTEKT India Ltd has announced 1:2 stock split, ex-date: 02 Sep 08

JTEKT India Ltd has announced 1:1 bonus issue, ex-date: 14 Sep 06

JTEKT India Ltd has announced 1:11 rights issue, ex-date: 25 Jul 25
Quality key factors
Valuation key factors
Technicals key factors
 Technical Indicator Scale: Bearish, Mildly Bearish, Sideways, Mildly Bullish, Bullish Turned
 Shareholding Snapshot : Mar 2026
Shareholding Compare (%holding)
Promoters
None
Held by 6 Schemes (11.08%)
Held by 29 FIIs (0.47%)
Jtekt Corporation (66.02%)
Nippon Life India Trustee Ltd-a/c Nippon India Sma (7.62%)
10.43%
Quarterly Results Snapshot (Standalone) - Mar'26 - YoY

YoY Growth in quarter ended Mar 2026 is 20.20% vs 2.71% in Mar 2025
YoY Growth in quarter ended Mar 2026 is 11.52% vs -28.13% in Mar 2025
Half Yearly Results Snapshot (Standalone) - Sep'25

Growth in half year ended Sep 2025 is 4.05% vs 9.12% in Sep 2024
Growth in half year ended Sep 2025 is -15.48% vs -29.60% in Sep 2024
Nine Monthly Results Snapshot (Standalone) - Dec'25
YoY Growth in nine months ended Dec 2025 is 7.72% vs 8.48% in Dec 2024
YoY Growth in nine months ended Dec 2025 is -2.41% vs -30.24% in Dec 2024
Annual Results Snapshot (Standalone) - Mar'26
YoY Growth in year ended Mar 2026 is 11.10% vs 6.85% in Mar 2025
YoY Growth in year ended Mar 2026 is 2.17% vs -29.57% in Mar 2025
About JTEKT India Ltd

Company Coordinates


