
Compare Jubilant Agri with Similar Stocks
Stock DNA
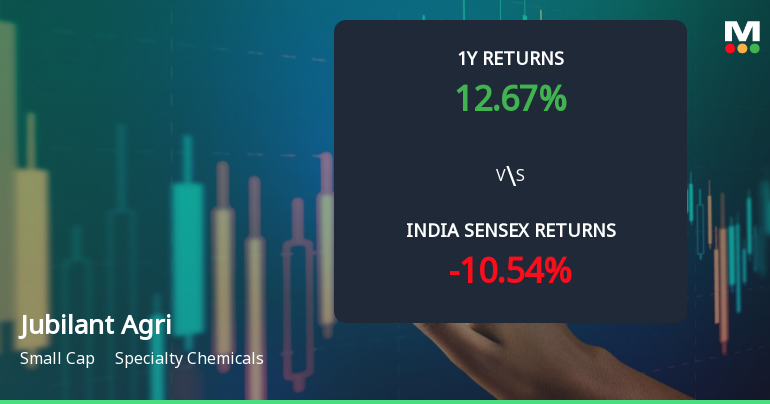
Specialty Chemicals
INR 2,827 Cr (Small Cap)
21.00
NA
0.00%
0.10
28.36%
5.89
Total Returns (Price + Dividend) 
Jubilant Agri for the last several years.
Risk Adjusted Returns v/s
Returns Beta

News
Jubilant Agri & Consumer Products Ltd Faces Mildly Bearish Technical Shift Amid Market Volatility
Jubilant Agri & Consumer Products Ltd has experienced a subtle but notable shift in its technical momentum, moving from a mildly bullish to a mildly bearish stance. This change is reflected across key technical indicators including moving averages and MACD, signalling a cautious outlook for investors amid broader market fluctuations.
Read full news article
Jubilant Agri & Consumer Products Ltd Technical Momentum Shifts Amid Mixed Signals
Jubilant Agri & Consumer Products Ltd, a small-cap player in the specialty chemicals sector, has recently exhibited a shift in its technical momentum from sideways to mildly bullish. Despite a modest decline in the daily price, key weekly indicators such as MACD, RSI, and On-Balance Volume (OBV) suggest improving buying interest, while daily moving averages and Dow Theory signals remain cautious. This nuanced technical landscape warrants a detailed analysis for investors seeking clarity on the stock’s near-term trajectory.
Read full news article
Jubilant Agri & Consumer Products Ltd is Rated Sell
Jubilant Agri & Consumer Products Ltd is rated 'Sell' by MarketsMOJO, with this rating last updated on 01 June 2026. However, the analysis and financial metrics discussed here reflect the stock's current position as of 08 June 2026, providing investors with the latest insights into the company’s performance and outlook.
Read full news article Announcements
Jubilant Agri And Consumer Products Limited Has Informed To The Exchange About Update On Capacity Addition.
03-Jun-2026 | Source : BSEUpdation on Capacity Addition.
Announcement under Regulation 30 (LODR)-Newspaper Publication
27-May-2026 | Source : BSEJubilant Agri and Consumer Products Limited informed the Exchange about copy of newspaper publication for Audited Financial Results for the quarter and financial year ended March 31 2026
Investor Presentation For Quarter And Financial Year Ended March 31 2026
26-May-2026 | Source : BSEInvestor Presentation on Financial Results for Quarter and Financial Year March 31 2026.
Corporate Actions

No Upcoming Board Meetings

No Dividend history available

No Splits history available

No Bonus history available

No Rights history available
Quality key factors
Valuation key factors
Technicals key factors
 Technical Indicator Scale: Bearish, Mildly Bearish, Sideways, Mildly Bullish, Bullish Turned
 Shareholding Snapshot : Mar 2026
Shareholding Compare (%holding)
Promoters
None
Held by 1 Schemes (0.0%)
Held by 8 FIIs (0.27%)
Hsb Trustee Company Pvt Ltd (35.1%)
Chetan Jayantilal Shah (2.44%)
18.36%
Quarterly Results Snapshot (Consolidated) - Mar'26 - QoQ

QoQ Growth in quarter ended Mar 2026 is 7.59% vs -12.08% in Dec 2025
QoQ Growth in quarter ended Mar 2026 is -7.39% vs -49.10% in Dec 2025
Half Yearly Results Snapshot (Standalone) - Sep'25
Not Applicable: The company has declared_date for only one period
Not Applicable: The company has declared_date for only one period
Nine Monthly Results Snapshot (Standalone) - Dec'25
Not Applicable: The company has declared_date for only one period
Not Applicable: The company has declared_date for only one period
Annual Results Snapshot (Consolidated) - Mar'26

YoY Growth in year ended Mar 2026 is 21.14% vs 24.56% in Mar 2025
YoY Growth in year ended Mar 2026 is 45.71% vs 195.26% in Mar 2025
About Jubilant Agri & Consumer Products Ltd

Company Coordinates


