
Compare Jubilant Food with Similar Stocks
Dashboard
High Debt Company with a Debt to Equity ratio (avg) of 1.52 times
- High Debt Company with a Debt to Equity ratio (avg) of 1.52 times
Healthy long term growth as Net Sales has grown by an annual rate of 23.54%
The company has declared Positive results for the last 4 consecutive quarters
With ROCE of 13.4, it has a Fair valuation with a 4.7 Enterprise value to Capital Employed
High Institutional Holdings at 53.86%
Below par performance in long term as well as near term
Stock DNA
Leisure Services
INR 28,773 Cr (Mid Cap)
69.00
43
0.28%
1.99
17.58%
12.47
Total Returns (Price + Dividend) 
Latest dividend: 1.2 per share ex-dividend date: Jul-18-2025
Risk Adjusted Returns v/s
Returns Beta

News

Jubilant Foodworks Ltd Upgraded to Hold on Improved Technicals and Fair Valuation
Jubilant Foodworks Ltd has seen its investment rating upgraded from Sell to Hold, reflecting a notable improvement in its technical indicators and valuation metrics. The company’s financial trends remain positive, supported by robust quarterly results, while its quality parameters maintain a steady outlook. This recalibration of the rating comes amid a mixed performance relative to the broader market, with the stock showing signs of recovery despite longer-term underperformance.
Read full news article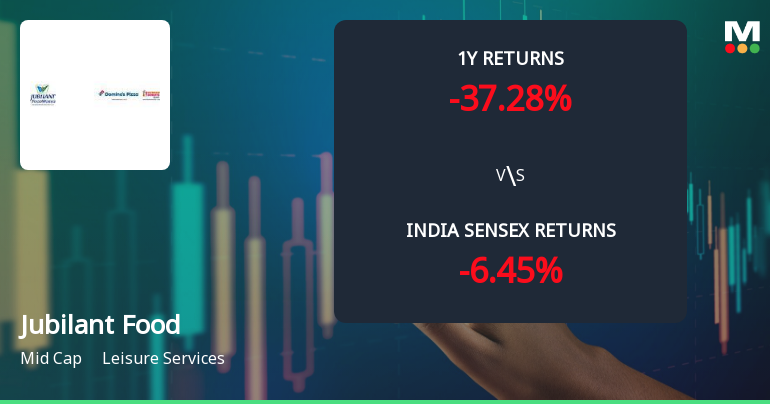
Jubilant Foodworks Ltd Technical Momentum Shifts Amid Mixed Market Signals
Jubilant Foodworks Ltd has experienced a notable shift in its technical parameters, reflecting a complex interplay of bullish and bearish signals across multiple timeframes. The stock’s recent price momentum, combined with evolving technical indicators such as MACD, RSI, and moving averages, suggests a cautious outlook despite a positive day change of 3.41% to ₹433.30 on 23 Jun 2026.
Read full news article
Jubilant Foodworks Ltd is Rated Sell
Jubilant Foodworks Ltd is rated Sell by MarketsMOJO, with this rating last updated on 08 June 2026. However, the analysis and financial metrics discussed here reflect the stock’s current position as of 20 June 2026, providing investors with the most up-to-date view of the company’s fundamentals, returns, and market standing.
Read full news article Announcements
Announcement under Regulation 30 (LODR)-Acquisition
15-Jun-2026 | Source : BSEInvestment in wholly owned subsidiary company
Announcement under Regulation 30 (LODR)-Analyst / Investor Meet - Intimation
03-Jun-2026 | Source : BSEPlease find attached Schedule of Institutional Investor Conference.
Disclosures under Reg. 29(1) of SEBI (SAST) Regulations 2011
01-Jun-2026 | Source : BSEThe Exchange has received the disclosure under Regulation 29(1) of SEBI (Substantial Acquisition of Shares & Takeovers) Regulations 2011 for Nippon India Mutual Fund
Corporate Actions

No Upcoming Board Meetings

Jubilant Foodworks Ltd has declared 60% dividend, ex-date: 18 Jul 25

Jubilant Foodworks Ltd has announced 2:10 stock split, ex-date: 19 Apr 22

Jubilant Foodworks Ltd has announced 1:1 bonus issue, ex-date: 21 Jun 18

No Rights history available
Quality key factors
Valuation key factors
Technicals key factors
 Technical Indicator Scale: Bearish, Mildly Bearish, Sideways, Mildly Bullish, Bullish Turned
 Shareholding Snapshot : Mar 2026
Shareholding Compare (%holding)
Promoters
1.3546
Held by 33 Schemes (30.29%)
Held by 506 FIIs (17.29%)
Jubilant Consumer Private Limited (40.27%)
Sbi Focused Fund (9.33%)
4.26%
Quarterly Results Snapshot (Consolidated) - Mar'26 - QoQ

QoQ Growth in quarter ended Mar 2026 is 2.89% vs 3.80% in Dec 2025

QoQ Growth in quarter ended Mar 2026 is 12.54% vs -61.89% in Dec 2025
Half Yearly Results Snapshot (Consolidated) - Sep'25
Growth in half year ended Sep 2025 is 18.35% vs 43.82% in Sep 2024
Growth in half year ended Sep 2025 is 131.78% vs -4.97% in Sep 2024
Nine Monthly Results Snapshot (Consolidated) - Dec'25
YoY Growth in nine months ended Dec 2025 is 16.42% vs 47.96% in Dec 2024
YoY Growth in nine months ended Dec 2025 is 114.24% vs -15.15% in Dec 2024
Annual Results Snapshot (Consolidated) - Mar'26
YoY Growth in year ended Mar 2026 is 17.37% vs 43.31% in Mar 2025
YoY Growth in year ended Mar 2026 is 103.30% vs -47.22% in Mar 2025
About Jubilant Foodworks Ltd

Company Coordinates


