
Compare Jubilant Food with Similar Stocks
Dashboard
High Debt Company with a Debt to Equity ratio (avg) of 1.52 times
- High Debt Company with a Debt to Equity ratio (avg) of 1.52 times
Healthy long term growth as Net Sales has grown by an annual rate of 23.54%
The company has declared Positive results for the last 4 consecutive quarters
With ROCE of 13.4, it has a Expensive valuation with a 4.9 Enterprise value to Capital Employed
High Institutional Holdings at 52.91%
Below par performance in long term as well as near term
Stock DNA
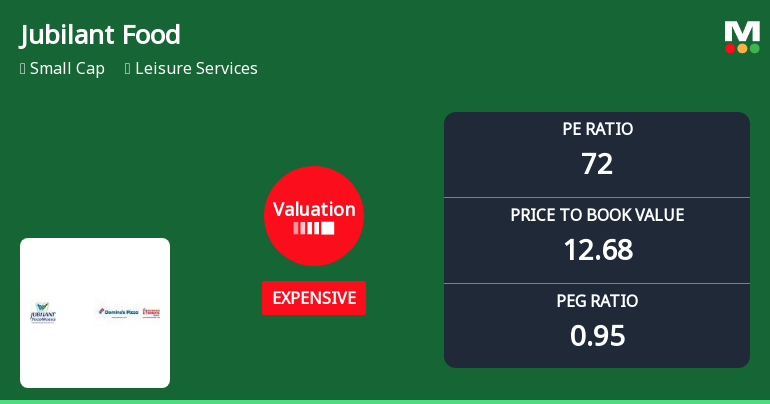
Leisure Services
INR 28,858 Cr (Small Cap)
72.00
46
0.27%
1.99
17.58%
12.70
Total Returns (Price + Dividend) 
Latest dividend: 1.2 per share ex-dividend date: Jul-17-2026
Risk Adjusted Returns v/s
Returns Beta

News
Jubilant Foodworks Ltd Valuation Shifts Signal Price Attractiveness Challenges
Jubilant Foodworks Ltd has experienced a notable shift in its valuation parameters, moving from a fair to an expensive rating, reflecting a significant change in price attractiveness. Despite a recent upgrade in its Mojo Grade from Sell to Hold, the company’s elevated price-to-earnings (P/E) and price-to-book value (P/BV) ratios raise questions about its relative value compared to peers and historical benchmarks.
Read full news article
Jubilant Foodworks Ltd Upgraded to Hold as Technicals Improve Amid Mixed Financials
Jubilant Foodworks Ltd has seen its investment rating upgraded from Sell to Hold, reflecting a nuanced improvement across technical indicators, valuation metrics, financial trends, and overall quality. This shift comes amid a backdrop of mixed returns but positive quarterly financial performance, signalling cautious optimism for investors in the leisure services sector.
Read full news article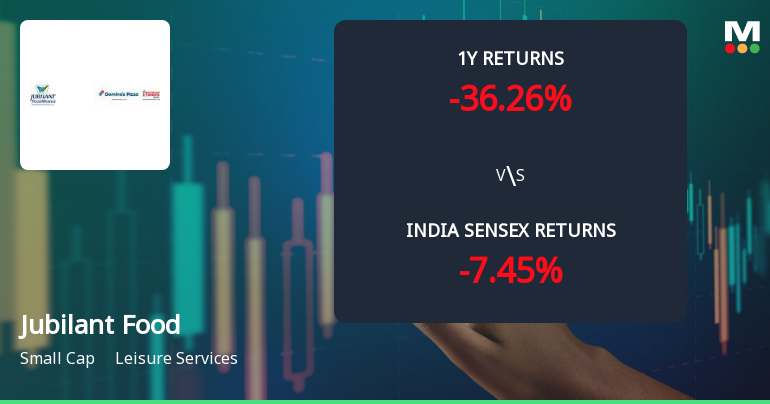
Jubilant Foodworks Ltd Technical Momentum Shifts Amid Bearish Sentiment
Jubilant Foodworks Ltd has experienced a nuanced shift in its technical momentum, reflecting a complex interplay of bullish and bearish signals across multiple timeframes. Despite a modest daily gain of 1.50%, the stock remains under pressure from longer-term bearish trends, prompting a downgrade in its Mojo Grade to Sell from Hold as of 22 July 2026.
Read full news article Announcements
Jubilant Foodworks Limited - Analysts/Institutional Investor Meet/Con. Call Updates
26-Nov-2019 | Source : NSEJubilant Foodworks Limited has informed the Exchange regarding Analysts/Institutional Investor Meet/Con. Call Updates
Jubilant Foodworks Limited - Analysts/Institutional Investor Meet/Con. Call Updates
13-Nov-2019 | Source : NSEJubilant Foodworks Limited has informed the Exchange regarding Analysts/Institutional Investor Meet/Con. Call Updates
Jubilant Foodworks Limited - Press Release
08-Nov-2019 | Source : NSEJubilant Foodworks Limited has informed the Exchange regarding a press release dated November 07, 2019, titled "Domino s launches a new brand campaign - Dil, Dosti, Domino s!".
Corporate Actions

13 Aug 2026

Jubilant Foodworks Ltd has declared 60% dividend, ex-date: 17 Jul 26

Jubilant Foodworks Ltd has announced 2:10 stock split, ex-date: 19 Apr 22

Jubilant Foodworks Ltd has announced 1:1 bonus issue, ex-date: 21 Jun 18

No Rights history available
Quality key factors
Valuation key factors
Technicals key factors
 Technical Indicator Scale: Bearish, Mildly Bearish, Sideways, Mildly Bullish, Bullish Turned
 Shareholding Snapshot : Jun 2026
Shareholding Compare (%holding)
Promoters
1.3546
Held by 35 Schemes (32.29%)
Held by 231 FIIs (13.32%)
Jubilant Consumer Private Limited (40.27%)
Sbi Elss Tax Saver Fund (9.39%)
5.06%
Quarterly Results Snapshot (Consolidated) - Mar'26 - QoQ

QoQ Growth in quarter ended Mar 2026 is 2.89% vs 3.80% in Dec 2025

QoQ Growth in quarter ended Mar 2026 is 12.54% vs -61.89% in Dec 2025
Half Yearly Results Snapshot (Consolidated) - Sep'25
Growth in half year ended Sep 2025 is 18.35% vs 43.82% in Sep 2024
Growth in half year ended Sep 2025 is 131.78% vs -4.97% in Sep 2024
Nine Monthly Results Snapshot (Consolidated) - Dec'25
YoY Growth in nine months ended Dec 2025 is 16.42% vs 47.96% in Dec 2024
YoY Growth in nine months ended Dec 2025 is 114.24% vs -15.15% in Dec 2024
Annual Results Snapshot (Consolidated) - Mar'26
YoY Growth in year ended Mar 2026 is 17.37% vs 43.31% in Mar 2025
YoY Growth in year ended Mar 2026 is 103.30% vs -47.22% in Mar 2025
About Jubilant Foodworks Ltd

Company Coordinates


