
Compare Just Dial with Similar Stocks
Dashboard
Poor Management Efficiency with a low ROE of 8.50%
- The company has been able to generate a Return on Equity (avg) of 8.50% signifying low profitability per unit of shareholders funds
Poor long term growth as Net Sales has grown by an annual rate of 12.45% over the last 5 years
Flat results in Mar 26
Falling Participation by Institutional Investors
Below par performance in long term as well as near term
Stock DNA
E-Retail/ E-Commerce
INR 4,666 Cr (Small Cap)
13.00
20
0.00%
-1.12
10.53%
0.94
Total Returns (Price + Dividend) 
Latest dividend: 2 per share ex-dividend date: Sep-10-2015
Risk Adjusted Returns v/s
Returns Beta

News
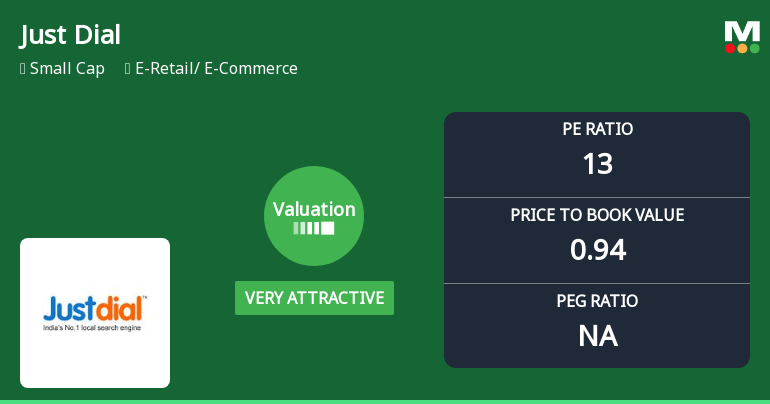
Just Dial Ltd: Valuation Shifts Signal Renewed Price Attractiveness Amid Challenging Returns
Just Dial Ltd., a small-cap player in the E-Retail and E-Commerce sector, has seen a significant shift in its valuation parameters, moving from an attractive to a very attractive rating. Despite a challenging performance track record relative to the broader market, the company’s current price-to-earnings (P/E) and price-to-book value (P/BV) ratios suggest a compelling entry point for value-focused investors.
Read full news article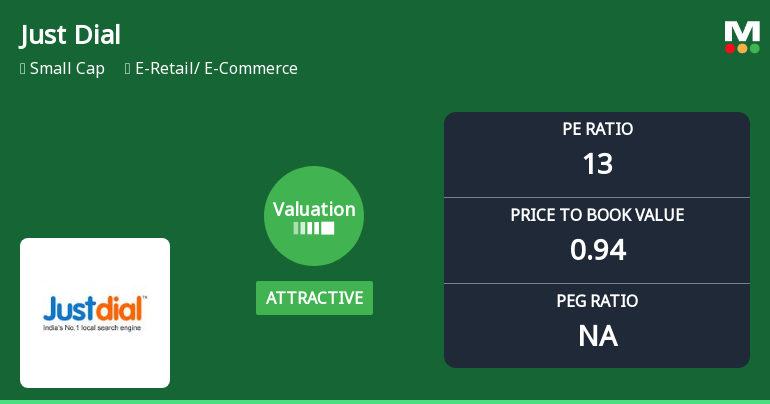
Just Dial Ltd: Valuation Shifts Signal Renewed Price Attractiveness Amidst Challenging Returns
Just Dial Ltd., a key player in the E-Retail and E-Commerce sector, has witnessed a notable shift in its valuation parameters, moving from a very attractive to an attractive rating. This change reflects evolving market perceptions amid challenging financial metrics and a competitive industry landscape.
Read full news article
Just Dial Ltd. is Rated Sell
Just Dial Ltd. is rated Sell by MarketsMOJO, a rating that was last updated on 02 Jan 2025. However, the analysis and financial metrics discussed here reflect the company’s current position as of 14 June 2026, providing investors with the latest insights into its performance and outlook.
Read full news article Announcements
Just Dial Limited - Analysts/Institutional Investor Meet/Con. Call Updates
15-Nov-2019 | Source : NSEJust Dial Limited has informed the Exchange regarding Analysts/Institutional Investor Meet/Con. Call Updates on Friday, November 15, 2019.
Just Dial Limited - Updates
23-Oct-2019 | Source : NSEJust Dial Limited has informed the Exchange regarding 'Certificate issued by M/s. Karvy Fintech Private Limited, Registrar and Share Transfer Agent (RTA) of the Company confirming the compliance of Regulation 74 (5) of SEBI (Depositories and Participants) Regulations, 2018.'.
Just Dial Limited - Press Release
22-Oct-2019 | Source : NSEJust Dial Limited has informed the Exchange regarding a press release dated October 21, 2019, titled "Press Release for the Quarter and Half Year ended September 30, 2019".
Corporate Actions

No Upcoming Board Meetings

Just Dial Ltd. has declared 20% dividend, ex-date: 10 Sep 15

No Splits history available

No Bonus history available

No Rights history available
Quality key factors
Valuation key factors
Technicals key factors
 Technical Indicator Scale: Bearish, Mildly Bearish, Sideways, Mildly Bullish, Bullish Turned
 Shareholding Snapshot : Mar 2026
Shareholding Compare (%holding)
Promoters
13.9034
Held by 10 Schemes (8.31%)
Held by 80 FIIs (4.83%)
Reliance Retail Ventures Limited (63.84%)
Quant Mutual Fund - Quant Small Cap Fund (4.43%)
9.27%
Quarterly Results Snapshot (Standalone) - Mar'26 - YoY

YoY Growth in quarter ended Mar 2026 is 6.24% vs 7.00% in Mar 2025
YoY Growth in quarter ended Mar 2026 is -36.55% vs 36.27% in Mar 2025
Half Yearly Results Snapshot (Standalone) - Sep'25
Growth in half year ended Sep 2025 is 6.28% vs 11.39% in Sep 2024
Growth in half year ended Sep 2025 is -5.49% vs 90.28% in Sep 2024
Nine Monthly Results Snapshot (Standalone) - Dec'25
YoY Growth in nine months ended Dec 2025 is 6.32% vs 10.37% in Dec 2024
YoY Growth in nine months ended Dec 2025 is -6.93% vs 72.57% in Dec 2024
Annual Results Snapshot (Standalone) - Mar'26
YoY Growth in year ended Mar 2026 is 6.30% vs 9.49% in Mar 2025
YoY Growth in year ended Mar 2026 is -14.92% vs 61.00% in Mar 2025
About Just Dial Ltd.

Company Coordinates


