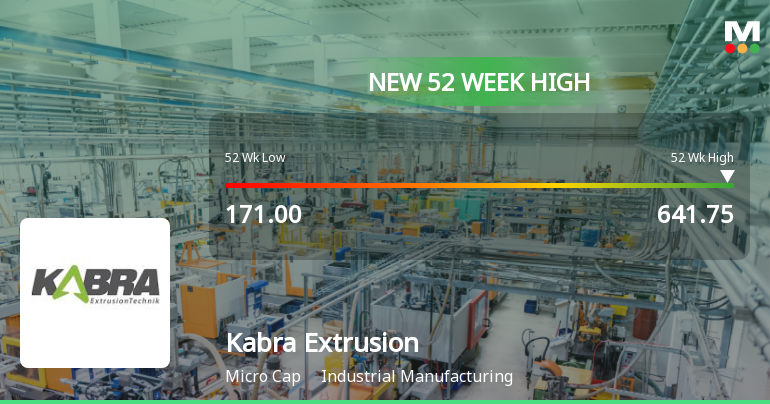
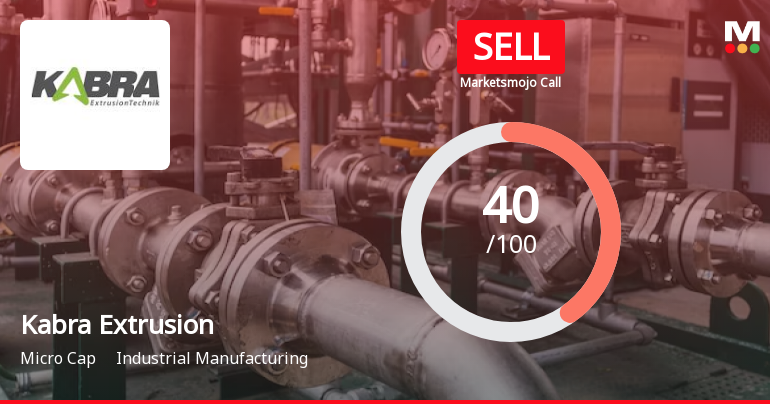
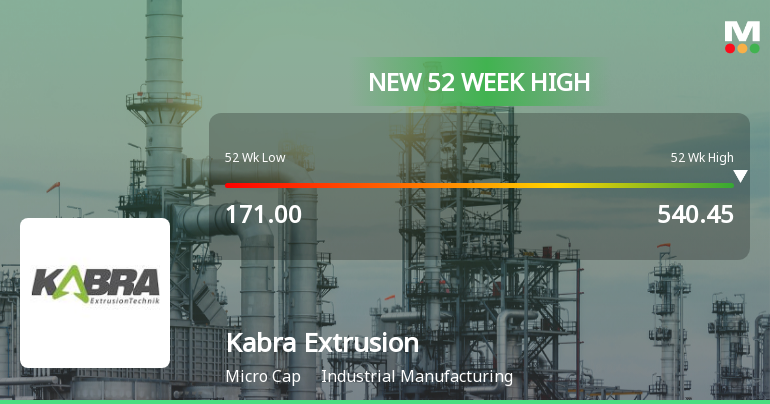
Kabra Extrusion

  • Market Cap: Micro Cap
  • Industry: Industrial Manufacturing
  • ISIN: INE900B01029
  • NSEID: KABRAEXTRU
  • BSEID: 524109
INR
633.95
54.2 (9.35%)
BSENSE

Sep 07, 02:27 PM

BSE+NSE Vol: 6.99 lacs

  • Price Points
  • Score
  • Mojo Parameters
  • Total Return
  • News and Corporate Actions
  • Key factors
  • Shareholding
  • Financials
  • CompanyCV
stock-summaryPrice Point
High/Low

1Day

52 Week

Valuation
Technical
Day's Volume

CASH

6.99 lacs (307.02%) Volume

Shareholding (Jun 2026)

FII

0.36%

Held by 5 FIIs

DII

0.02%

Held by 0 DIIs

Promoter

60.44%

Why is Kabra Extrusion Technik Ltd falling/rising?

06-Sep-2026

As of 05-Sep, Kabra Extrusion Technik Ltd's stock price is at Rs 579.75, up 2.48%, with a strong monthly gain of 40.24% and a year-to-date increase of 156.13%. Despite a decline in investor participation, the stock shows positive momentum and remains above key moving averages, indicating a bullish trend.

As of 05-Sep, Kabra Extrusion Technik Ltd's stock price is rising, currently at Rs 579.75, reflecting an increase of Rs 14.05 or 2.48%. The stock has shown a strong performance over the past month, with a remarkable gain of 40.24%, significantly outperforming the Sensex, which declined by 2.44% during the same period. Additionally, year-to-date, the stock has surged by 156.13%, while the Sensex has fallen by 10.21%. <BR><BR>Today, the stock has outperformed its sector by 3.25% and has experienced consecutive gains over the last two days, accumulating a total return of 3.52% in that timeframe. The stock reached an intraday high of Rs 583.4, indicating positive momentum. Furthermore, it is trading above its 20-day, 50-day, 100-day, and 200-day moving averages, which typically suggests a bullish trend. <BR><BR>However, it is important to note that there has been a decline in investor participation, with delivery volume falling by 21.25% compared to the 5-day average. Despite this decrease in participation, the stock remains liquid enough for trading, indicating that the overall positive performance and recent gains are driving the stock price upward.

View full answer

Who are in the management team of Kabra Extrusion?

01-Sep-2026

The management team of Kabra Extrusion includes Executive Chairman Shreevallabh G Kabra, Vice Chairman & Managing Director Anand S Kabra, Managing Director Ekta A Kabra, and several independent directors, along with Company Secretary Antony Alapat, who collectively guide the company's strategic direction and governance.

The management team of Kabra Extrusion includes the following key members:<BR><BR>1. **Shreevallabh G Kabra** - Executive Chairman<BR>2. **Satyanarayan G Kabra** - Director<BR>3. **Anand S Kabra** - Vice Chairman & Managing Director<BR>4. **Ekta A Kabra** - Managing Director<BR>5. **B L Bagra** - Non-Executive & Independent Director<BR>6. **Boman Moradian** - Non-Executive & Independent Director<BR>7. **Chitra Andrade** - Independent Director<BR>8. **Utpal Sheth** - Independent Director<BR>9. **Antony Alapat** - Company Secretary & Compliance Officer<BR><BR>This team plays a crucial role in the strategic direction and governance of the company.

View full answer

What does Kabra Extrusion do?

01-Sep-2026

Kabra Extrusion Technik Ltd specializes in high-performance extrusion solutions for pipes and films in the industrial sector. As of June 2026, it reported net sales of 124 Cr and a net loss of 2 Cr, with a market cap of INR 2,058 Cr.

Overview: <BR>Kabra Extrusion Technik Ltd specializes in high-performance extrusion solutions for manufacturing pipes and films within the industrial manufacturing sector and operates as a micro-cap company.<BR><BR>History: <BR>Incorporated in October 1982, Kabra Extrusion Technik Ltd is the flagship company of the Kolsite Group. The latest quarterly results reported net sales and net profit for June 2026.<BR><BR>Financial Snapshot: <BR>Most recent Net Sales: 124 Cr (Quarterly Results - Jun 2026) <BR>Most recent Net Profit: -2 Cr (Quarterly Results - Jun 2026) <BR>Market-cap value: INR 2,058 Cr (Micro Cap)<BR><BR>Key Metrics: <BR>P/E: 3,002.00 <BR>Industry P/E: 41 <BR>Dividend Yield: 0.00% <BR>Debt-Equity: 0.27 <BR>Return on Equity: -1.17% <BR>Price to Book: 4.79<BR><BR>Contact Details: <BR>Address: Fortune Terraces 10th Flr, New Link Road Andheri (W) Mumbai Maharashtra : 400053 <BR>Tel: 91-22-26734822/23/24/25 <BR>Email: ket_sd@kolsitegroup.com <BR>Website: http://www.kolsite.com

View full answer

Who are the peers of the Kabra Extrusion?

01-Sep-2026

Kabra Extrusion's peers include Kilburn Engg., Pennar Industrie, HLE Glascoat, Honda India, Indian Hume Pipe, Disa India, Vinyas Innovativ, Macpower CNC, and OBSC Perfection. Kabra Extrusion has the highest 1-year return at 107.95%, while HLE Glascoat has the lowest at -40.38%.

Peers: The peers of Kabra Extrusion are Kilburn Engg., Pennar Industrie, HLE Glascoat, Honda India, Indian Hume Pipe, Disa India, Vinyas Innovativ, Macpower CNC, and OBSC Perfection.<BR><BR>Quality Snapshot: Excellent management risk is observed at HLE Glascoat, Honda India, and Disa India, while Average management risk is found at Kilburn Engg., Pennar Industrie, Kabra Extrusion, Indian Hume Pipe, Vinyas Innovativ, Macpower CNC, and OBSC Perfection. Good growth is seen at Kilburn Engg., Macpower CNC, and OBSC Perfection, while Below Average growth is noted at Pennar Industrie, HLE Glascoat, Honda India, Kabra Extrusion, Indian Hume Pipe, and Disa India. Excellent growth is reported at Vinyas Innovativ, and the rest have Below Average growth. Excellent capital structure is present at Kilburn Engg., Honda India, and Macpower CNC, while Average capital structure is found at Kabra Extrusion, Indian Hume Pipe, Vinyas Innovativ, and OBSC Perfection, with Below Average capital structure at Pennar Industrie and HLE Glascoat.<BR><BR>Return Snapshot: The peer with the highest 1-year return is Kabra Extrusion at 107.95%, while the lowest is HLE Glascoat at -40.38%. Kabra Extrusion's return is significantly higher than all peers. Additionally, the six-month return is negative for HLE Glascoat, Honda India, and Disa India.

View full answer

How big is Kabra Extrusion?

01-Sep-2026

As of 31st August, Kabra Extrusion Technik Ltd has a market capitalization of 2,058.00 Cr, with net sales of 489.58 Cr and a net profit of 0.51 Cr reported in the latest four quarters. Shareholder's funds are 441.48 Cr, and total assets are valued at 767.15 Cr as of March 2026.

As of 31st August, Kabra Extrusion Technik Ltd has a market capitalization of 2,058.00 Cr, categorizing it as a Micro Cap company.<BR><BR>In the latest four quarters, Kabra Extrusion reported net sales of 489.58 Cr and a net profit of 0.51 Cr.<BR><BR>The latest annual period for the balance sheet is March 2026, with shareholder's funds amounting to 441.48 Cr and total assets valued at 767.15 Cr.

View full answer

Are Kabra Extrusion Technik Ltd latest results good or bad?

31-Jul-2026

Kabra Extrusion Technik Ltd's latest results are concerning, showing a 44.81% revenue growth but a net loss of ₹1.74 crores, down from a profit in the previous quarter. The decline in operating margins and negative returns on equity indicate significant challenges, leading to a 7.19% drop in stock price post-announcement.

Kabra Extrusion Technik Ltd's latest results indicate a challenging situation for the company. While it reported a significant revenue growth of 44.81% year-on-year, reaching ₹124.49 crores, this growth has not translated into profitability. The company posted a net loss of ₹1.74 crores for the quarter, a stark contrast to the profit of ₹6.90 crores in the previous quarter. This marks a concerning trend, as it reflects a decline in operational efficiency and margin compression.<BR><BR>The operating margin has dropped to 4.97%, down from 11.58% a year ago, signaling significant pressure on profitability. The company's return on equity (ROE) and return on capital employed (ROCE) have also turned negative, indicating that it is currently destroying shareholder value rather than creating it.<BR><BR>The market reacted negatively to these results, with the stock price falling by 7.19% following the announcement. Overall, while the revenue growth is a positive sign, the inability to achieve profitability and the deterioration in key financial metrics suggest that the latest results are more bad than good for Kabra Extrusion.

View full answer

Should I buy, sell or hold Kabra Extrusion Technik Ltd?

31-Jul-2026

When is the next results date for Kabra Extrusion Technik Ltd?

23-Jul-2026

The next results date for Kabra Extrusion Technik Ltd is 30 July 2026.

The next results date for Kabra Extrusion Technik Ltd is scheduled for 30 July 2026.

View full answer

Is Kabra Extrusion overvalued or undervalued?

10-Nov-2025

As of November 7, 2025, Kabra Extrusion is considered overvalued with a PE ratio of 290.49 and an EV to EBITDA of 35.69, alongside low ROCE and ROE, and a year-to-date return of -58.19%, indicating a significant shift in its valuation from fair to risky.

As of 7 November 2025, the valuation grade for Kabra Extrusion has moved from fair to risky, indicating a significant shift in its perceived value. The company is currently considered overvalued, with a staggering PE ratio of 290.49 and an EV to EBITDA ratio of 35.69, both of which are considerably higher than its peers. In comparison, Thermax, a peer in the industrial manufacturing sector, has a PE ratio of 56.7 and an EV to EBITDA of 37.35, while BEML Ltd shows a PE of 56.53 and an EV to EBITDA of 45.17, highlighting the extreme valuation of Kabra Extrusion.<BR><BR>Additionally, Kabra Extrusion's ROCE stands at a mere 4.77% and ROE at 5.28%, which are low compared to industry standards. The company's recent stock performance has also been poor, with a year-to-date return of -58.19%, significantly underperforming the Sensex, which has gained 6.50% during the same period. This combination of high valuation ratios and weak financial performance suggests that Kabra Extrusion is overvalued in the current market.

View full answer

How has been the historical performance of Kabra Extrusion?

06-Nov-2025

Kabra Extrusion's historical performance indicates a decline in net sales from 670.01 Cr in March 2023 to 476.85 Cr in March 2025, despite stable profit after tax and improved cash flow from operations. Concerns arise from increasing liabilities and fluctuating profitability amidst decreasing sales.

Answer:<BR>The historical performance of Kabra Extrusion shows a fluctuating trend in net sales and profitability over the years, with a notable decline in recent periods.<BR><BR>Breakdown:<BR>Kabra Extrusion's net sales peaked at 670.01 Cr in March 2023 but have since decreased to 476.85 Cr by March 2025. The total operating income followed a similar trend, declining from 670.01 Cr in March 2023 to 476.85 Cr in March 2025. Raw material costs have also decreased from 492.24 Cr in March 2023 to 320.52 Cr in March 2025, while employee costs rose slightly to 50.26 Cr in March 2025 from 47.72 Cr in March 2023. Operating profit (PBDIT) saw a decline from 77.24 Cr in March 2023 to 62.65 Cr in March 2025, with a corresponding drop in profit before tax from 54.56 Cr to 39.27 Cr. The profit after tax remained relatively stable, increasing slightly from 31.58 Cr in March 2024 to 31.66 Cr in March 2025. Total liabilities increased from 716.13 Cr in March 2024 to 787.09 Cr in March 2025, while total assets also rose from 716.13 Cr to 787.09 Cr in the same period. Cash flow from operating activities improved to 42.00 Cr in March 2025, up from 32.00 Cr in March 2024, although the net cash outflow for March 2025 was -4.00 Cr. Overall, while Kabra Extrusion has shown some resilience in profitability, the declining sales and increasing liabilities are areas of concern.

View full answer

Is Kabra Extrusion technically bullish or bearish?

24-Sep-2025

As of September 23, 2025, Kabra Extrusion's technical trend has shifted to bearish, driven by negative signals from daily moving averages, weekly KST, and Bollinger Bands, despite a mildly bullish weekly MACD, with a year-to-date decline of 49.82% reinforcing this sentiment.

As of 23 September 2025, the technical trend for Kabra Extrusion has changed from mildly bearish to bearish. The current technical stance is bearish with moderate strength. Key indicators driving this stance include the daily moving averages showing bearish signals, the weekly KST and Bollinger Bands both indicating bearish conditions, and the monthly MACD reflecting a bearish outlook. Although the weekly MACD is mildly bullish, it is outweighed by the overall bearish signals from other indicators. The stock's recent performance, particularly a significant year-to-date decline of 49.82%, further supports the bearish sentiment.

View full answer

Who are the top shareholders of the Kabra Extrusion?

06-Jun-2025

The top shareholders of Kabra Extrusion include Anand Shreevallabh Kabra with 18.2%, followed by public shareholder Seema Heinz Mathias at 1.07%. Individual investors hold 27.35%, while foreign institutional investors and mutual funds account for 1.46% and 0.01%, respectively, with no pledged promoter holdings reported.

The top shareholders of Kabra Extrusion include the promoters, with Anand Shreevallabh Kabra holding the highest individual stake at 18.2%. In terms of public shareholders, Seema Heinz Mathias is the largest, owning 1.07%. Additionally, individual investors collectively hold 27.35% of the shares. The company also has some institutional involvement, with 16 Foreign Institutional Investors (FIIs) holding a total of 1.46% and two mutual fund schemes holding 0.01%. There are no pledged promoter holdings reported.

View full answer

What is the bonus history of the Kabra Extrusion?

06-Jun-2025

Kabra Extrusion Technik Ltd announced a 1:1 bonus issue on September 6, 2010, with a record date of September 7, 2010, allowing shareholders to double their holdings.

Kabra Extrusion Technik Ltd has a bonus history that includes a 1:1 bonus issue announced on September 6, 2010. The record date for this bonus was September 7, 2010. This means that for every share held, shareholders received an additional share, effectively doubling their holdings at that time. If you have any more questions about the company or its financial activities, feel free to ask!

View full answer

Has Kabra Extrusion declared dividend?

06-Jun-2025

Kabra Extrusion Technik Ltd has declared a 70% dividend, amounting to ₹3.5 per share, with an ex-date of July 12, 2024. While the company shows significant volatility in total returns, it has experienced negative returns in the short term and strong positive returns over the longer term.

Kabra Extrusion Technik Ltd has declared a 70% dividend.<BR><BR>Dividend Details:<BR>- Percentage announced: 70%<BR>- Amount per share: 3.5<BR>- Ex-date: Jul-12-2024<BR><BR>Dividend Yield: 1.25%.<BR><BR>Total Returns by Period:<BR>In the last 6 months, the price return was -45.56%, the dividend return was 0%, resulting in a total return of -45.56%.<BR><BR>Over the past year, the price return was -29.63%, the dividend return was 0.83%, leading to a total return of -28.8%.<BR><BR>In the 2-year period, there was a price return of -39.34%, a dividend return of 1.53%, culminating in a total return of -37.81%.<BR><BR>For the 3-year period, the price return was -15.68%, with a dividend return of 3.49%, resulting in a total return of -12.19%.<BR><BR>In the last 4 years, the price return was 46.58%, the dividend return was 6.39%, giving a total return of 52.97%.<BR><BR>Finally, over 5 years, the price return was 463.99%, the dividend return was 23.74%, resulting in an impressive total return of 487.73%.<BR><BR>Overall, while Kabra Extrusion has declared a dividend, the total returns over various periods show significant volatility, with negative returns in the shorter terms and strong positive returns over the longer term, indicating a mixed performance.

View full answer
iScoreScore
Click here to find our call on this stock
Strong Sell
Sell
Hold
Buy
Strong Buy

Dashboard

1

Weak Long Term Fundamental Strength with a -181.53% CAGR growth in Operating Profits over the last 5 years

  • The company has been able to generate a Return on Equity (avg) of 6.35% signifying low profitability per unit of shareholders funds
2

Flat results in Jun 26

3

Risky - Negative Operating Profits

4

Despite the size of the company, domestic mutual funds hold only 0.03% of the company

stock-summaryMojo Parameters

Mojo Parameters

Loading Valuation Snapshot...

Stock DNA

stock-summary
Industry

Industrial Manufacturing

stock-summary
Market cap

INR 2,217 Cr (Micro Cap)

stock-summary
P/E

2,908.00

stock-summary
Industry P/E

42

stock-summary
Dividend Yield

0.00%

stock-summary
Debt Equity

0.27

stock-summary
Return on Equity

-1.17%

stock-summary
Price to Book

4.60

Revenue and Profits:
Net Sales:
124 Cr
(Quarterly Results - Jun 2026)
Net Profit:
-2 Cr
stock-summaryTotal Returns
Total Returns (Price + Dividend) stock-summary
Dividend Yield (0%)
TimePeriod
Price Return
Dividend Return
Total Return
3 Months
169.02%
0%
169.02%
6 Months
155.47%
0%
155.47%
1 Year
133.28%
0%
133.28%
2 Years
57.95%
0.53%
58.48%
3 Years
27.39%
1.36%
28.75%
4 Years
57.03%
2.56%
59.59%
5 Years
165.64%
4.70%
170.34%

Latest dividend: 2.5 per share ex-dividend date: Jul-09-2025

Risk Adjusted Returns v/s stock-summary
Returns Beta
Icon
Beta has not been calculated since enough price history is not available
stock-summaryNews & Corporate Actions

Announcements stock-summary

Intimation Under Regulation 30 Of The SEBI (Listing Obligations And Disclosure Requirements) Regulations 2015 - Receipt Of Letter Of Nomination

05-Sep-2026 | Source : BSE

Intimation

Board Meeting Outcome for Outcome Of Board Meeting Of The Company Held On September 05 2026.

05-Sep-2026 | Source : BSE

Outcome of Board meeting

Shareholder Meeting / Postal Ballot-Scrutinizer"s Report

03-Sep-2026 | Source : BSE

Disclosures of voting results

Corporate Actions stock-summary

stock-summary
BOARD MEETING

No Upcoming Board Meetings

stock-summary
DIVIDEND

Kabra Extrusion Technik Ltd has declared 50% dividend, ex-date: 09 Jul 25

stock-summary
SPLITS

Kabra Extrusion Technik Ltd has announced 5:10 stock split, ex-date: 17 May 10

stock-summary
BONUS

Kabra Extrusion Technik Ltd has announced 1:1 bonus issue, ex-date: 06 Sep 10

stock-summary
RIGHTS

No Rights history available

stock-summaryKey Factors

Quality key factors stock-summary

Factor
Value
Sales Growth (5y)
10.81%
EBIT Growth (5y)
-181.53%
EBIT to Interest (avg)
4.57
Debt to EBITDA (avg)
3.14
Net Debt to Equity (avg)
0.27
Sales to Capital Employed (avg)
1.05
Tax Ratio
100.00%
Dividend Payout Ratio
0
Pledged Shares
0
Institutional Holding
0.38%
ROCE (avg)
8.73%
ROE (avg)
6.35%

Valuation key factors

Factor
Value
P/E Ratio
2908
Industry P/E
42
Price to Book Value
4.60
EV to EBIT
-171.04
EV to EBITDA
109.83
EV to Capital Employed
3.84
EV to Sales
4.39
PEG Ratio
NA
Dividend Yield
NA
ROCE (Latest)
-3.53%
ROE (Latest)
-1.17%

Technicals key factors

Indicator
Weekly
Monthly
MACD
Bullish
Bullish
RSI
Bearish
Bearish
Bollinger Bands
Mildly Bullish
Mildly Bullish
Moving Averages
Bullish (Daily)
KST
Bullish
Bullish
Dow Theory
Mildly Bullish
No Trend
OBV
Bullish
No Trend
stock-summary Technical Indicator Scale: Bearish, Mildly Bearish, Sideways, Mildly Bullish, Bullish  Turned 
stock-summaryShareholding
Shareholding Snapshot : Jun 2026stock-summary
Shareholding Compare (%holding) stock-summary
Majority shareholders

Promoters

Pledged Promoter Holdings

None

Mutual Funds

Held by 2 Schemes (0.01%)

FIIs

Held by 5 FIIs (0.36%)

Promoter with highest holding

Anand Shreevallabh Kabra (19.03%)

Highest Public shareholder

Seema Heinz Mathias (1.07%)

Individual Investors Holdings

28.03%

stock-summaryFinancial
[
  {
    "link": "quarterly",
    "btn_text": "All Quarterly Results",
    "header": "Quarterly Results Snapshot (Consolidated) - Jun'26 - YoY",
    "rhs": [
      {
        "prefix": "Net Sales ",
        "suffix": "YoY Growth in quarter ended Jun 2026 is 44.81% vs -2.53% in Jun 2025",
        "dir": 1
      },
      {
        "prefix": "Consolidated Net Profit ",
        "suffix": "YoY Growth in quarter ended Jun 2026 is 77.14% vs -478.61% in Jun 2025",
        "dir": 1
      }
    ],
    "table": {
      "header": [
        "Jun'26",
        "Jun'25",
        "Change(%)"
      ],
      "body": [
        {
          "field": "Net Sales",
          "val1": "124.49",
          "val2": "85.97",
          "chgp": "44.81%",
          "chgp_class": "positive"
        },
        {
          "field": "Operating Profit (PBDIT) excl Other Income",
          "val1": "6.19",
          "val2": "-2.95",
          "chgp": "309.83%",
          "chgp_class": "positive"
        },
        {
          "field": "Interest",
          "val1": "3.82",
          "val2": "2.66",
          "chgp": "43.61%",
          "chgp_class": "negative"
        },
        {
          "field": "Exceptional Items",
          "val1": "0.00",
          "val2": "0.00",
          "chgp": "",
          "chgp_class": "neutral"
        },
        {
          "field": "Consolidate Net Profit",
          "val1": "-1.74",
          "val2": "-7.61",
          "chgp": "77.14%",
          "chgp_class": "positive"
        },
        {
          "field": "Operating Profit Margin (Excl OI)",
          "val1": "4.97%",
          "val2": "-3.43%",
          "chgp": "8.40%",
          "chgp_class": "positive"
        }
      ]
    }
  },
  {
    "link": "half-yearly",
    "btn_text": "All Half Yearly Results",
    "header": "Half Yearly Results Snapshot (Consolidated) - Sep'25",
    "rhs": [
      {
        "prefix": "Net Sales ",
        "suffix": " Growth in half year ended Sep 2025 is 2.05% vs -31.60% in Sep 2024",
        "dir": 1
      },
      {
        "prefix": "Consolidated Net Profit ",
        "suffix": " Growth in half year ended Sep 2025 is -150.77% vs 25.79% in Sep 2024",
        "dir": -1
      }
    ],
    "table": {
      "header": [
        "Sep'25",
        "Sep'24",
        "Change(%)"
      ],
      "body": [
        {
          "field": "Net Sales",
          "val1": "220.57",
          "val2": "216.14",
          "chgp": "2.05%",
          "chgp_class": "positive"
        },
        {
          "field": "Operating Profit (PBDIT) excl Other Income",
          "val1": "6.00",
          "val2": "31.19",
          "chgp": "-80.76%",
          "chgp_class": "negative"
        },
        {
          "field": "Interest",
          "val1": "5.34",
          "val2": "4.80",
          "chgp": "11.25%",
          "chgp_class": "negative"
        },
        {
          "field": "Exceptional Items",
          "val1": "0.00",
          "val2": "0.00",
          "chgp": "",
          "chgp_class": "neutral"
        },
        {
          "field": "Consolidate Net Profit",
          "val1": "-7.28",
          "val2": "14.34",
          "chgp": "-150.77%",
          "chgp_class": "negative"
        },
        {
          "field": "Operating Profit Margin (Excl OI)",
          "val1": "2.72%",
          "val2": "14.43%",
          "chgp": "-11.71%",
          "chgp_class": "negative"
        }
      ]
    }
  },
  {
    "link": "nine-monthly",
    "btn_text": "All Nine Monthly Results",
    "header": "Nine Monthly Results Snapshot (Consolidated) - Dec'25",
    "rhs": [
      {
        "prefix": "Net Sales ",
        "suffix": "YoY Growth in nine months ended Dec 2025 is -1.90% vs -23.32% in Dec 2024",
        "dir": 1
      },
      {
        "prefix": "Consolidated Net Profit ",
        "suffix": "YoY Growth in nine months ended Dec 2025 is -157.34% vs 43.97% in Dec 2024",
        "dir": -1
      }
    ],
    "table": {
      "header": [
        "Dec'25",
        "Dec'24",
        "Change(%)"
      ],
      "body": [
        {
          "field": "Net Sales",
          "val1": "330.91",
          "val2": "337.31",
          "chgp": "-1.90%",
          "chgp_class": "negative"
        },
        {
          "field": "Operating Profit (PBDIT) excl Other Income",
          "val1": "7.48",
          "val2": "45.22",
          "chgp": "-83.46%",
          "chgp_class": "negative"
        },
        {
          "field": "Interest",
          "val1": "8.31",
          "val2": "7.82",
          "chgp": "6.27%",
          "chgp_class": "negative"
        },
        {
          "field": "Exceptional Items",
          "val1": "0.00",
          "val2": "0.00",
          "chgp": "",
          "chgp_class": "neutral"
        },
        {
          "field": "Consolidate Net Profit",
          "val1": "-12.26",
          "val2": "21.38",
          "chgp": "-157.34%",
          "chgp_class": "negative"
        },
        {
          "field": "Operating Profit Margin (Excl OI)",
          "val1": "2.26%",
          "val2": "13.41%",
          "chgp": "-11.15%",
          "chgp_class": "negative"
        }
      ]
    }
  },
  {
    "link": "annual",
    "btn_text": "All Annual Results",
    "header": "Annual Results Snapshot (Consolidated) - Mar'26",
    "rhs": [
      {
        "prefix": "Net Sales ",
        "suffix": "YoY Growth in year ended Mar 2026 is -5.41% vs -21.54% in Mar 2025",
        "dir": 1
      },
      {
        "prefix": "Consolidated Net Profit ",
        "suffix": "YoY Growth in year ended Mar 2026 is -116.68% vs -4.79% in Mar 2025",
        "dir": -1
      }
    ],
    "table": {
      "header": [
        "Mar'26",
        "Mar'25",
        "Change(%)"
      ],
      "body": [
        {
          "field": "Net Sales",
          "val1": "451.05",
          "val2": "476.85",
          "chgp": "-5.41%",
          "chgp_class": "negative"
        },
        {
          "field": "Operating Profit (PBDIT) excl Other Income",
          "val1": "10.44",
          "val2": "49.67",
          "chgp": "-78.98%",
          "chgp_class": "negative"
        },
        {
          "field": "Interest",
          "val1": "11.39",
          "val2": "11.17",
          "chgp": "1.97%",
          "chgp_class": "negative"
        },
        {
          "field": "Exceptional Items",
          "val1": "-0.24",
          "val2": "8.49",
          "chgp": "-102.83%",
          "chgp_class": "negative"
        },
        {
          "field": "Consolidate Net Profit",
          "val1": "-5.37",
          "val2": "32.20",
          "chgp": "-116.68%",
          "chgp_class": "negative"
        },
        {
          "field": "Operating Profit Margin (Excl OI)",
          "val1": "2.31%",
          "val2": "10.42%",
          "chgp": "-8.11%",
          "chgp_class": "negative"
        }
      ]
    }
  }
]

Quarterly Results Snapshot (Consolidated) - Jun'26 - YoYstock-summary

Jun'26
Jun'25
Change(%)
Net Sales
124.49
85.97
44.81%
Operating Profit (PBDIT) excl Other Income
6.19
-2.95
309.83%
Interest
3.82
2.66
43.61%
Exceptional Items
0.00
0.00
Consolidate Net Profit
-1.74
-7.61
77.14%
Operating Profit Margin (Excl OI)
4.97%
-3.43%
8.40%
Values in Rs Cr.
Direction Arrows
Net Sales

YoY Growth in quarter ended Jun 2026 is 44.81% vs -2.53% in Jun 2025

Direction Arrows
Consolidated Net Profit

YoY Growth in quarter ended Jun 2026 is 77.14% vs -478.61% in Jun 2025

Half Yearly Results Snapshot (Consolidated) - Sep'25stock-summary

Sep'25
Sep'24
Change(%)
Net Sales
220.57
216.14
2.05%
Operating Profit (PBDIT) excl Other Income
6.00
31.19
-80.76%
Interest
5.34
4.80
11.25%
Exceptional Items
0.00
0.00
Consolidate Net Profit
-7.28
14.34
-150.77%
Operating Profit Margin (Excl OI)
2.72%
14.43%
-11.71%
Values in Rs Cr.
Direction Arrows
Net Sales

Growth in half year ended Sep 2025 is 2.05% vs -31.60% in Sep 2024

Direction Arrows
Consolidated Net Profit

Growth in half year ended Sep 2025 is -150.77% vs 25.79% in Sep 2024

Nine Monthly Results Snapshot (Consolidated) - Dec'25stock-summary

Dec'25
Dec'24
Change(%)
Net Sales
330.91
337.31
-1.90%
Operating Profit (PBDIT) excl Other Income
7.48
45.22
-83.46%
Interest
8.31
7.82
6.27%
Exceptional Items
0.00
0.00
Consolidate Net Profit
-12.26
21.38
-157.34%
Operating Profit Margin (Excl OI)
2.26%
13.41%
-11.15%
Values in Rs Cr.
Direction Arrows
Net Sales

YoY Growth in nine months ended Dec 2025 is -1.90% vs -23.32% in Dec 2024

Direction Arrows
Consolidated Net Profit

YoY Growth in nine months ended Dec 2025 is -157.34% vs 43.97% in Dec 2024

Annual Results Snapshot (Consolidated) - Mar'26stock-summary

Mar'26
Mar'25
Change(%)
Net Sales
451.05
476.85
-5.41%
Operating Profit (PBDIT) excl Other Income
10.44
49.67
-78.98%
Interest
11.39
11.17
1.97%
Exceptional Items
-0.24
8.49
-102.83%
Consolidate Net Profit
-5.37
32.20
-116.68%
Operating Profit Margin (Excl OI)
2.31%
10.42%
-8.11%
Values in Rs Cr.
Direction Arrows
Net Sales

YoY Growth in year ended Mar 2026 is -5.41% vs -21.54% in Mar 2025

Direction Arrows
Consolidated Net Profit

YoY Growth in year ended Mar 2026 is -116.68% vs -4.79% in Mar 2025

stock-summaryCompany CV
About Kabra Extrusion Technik Ltd stock-summary
stock-summary
Kabra Extrusion Technik Ltd
Micro Cap
Industrial Manufacturing
Incorporated in October 1982, Kabra Extrusion Technik Limited (KETL) is the flagship company of Kolsite Group and one of the largest players in the Plastic Extrusion Machinery known for innovative offerings. The Company specialize in delivering high performance extrusion solutions for manufacturing pipes and films. It has two manufacturing locations in Daman. Company has set benchmarks in plastics extrusion industry by modern R&D techniques and various processes to cater the market requirements.
Company Coordinates stock-summary
Company Details
Fortune Terraces 10th Flr, New Link Road Andheri (W) Mumbai Maharashtra : 400053
stock-summary
Tel: 91-22-26734822/23/24/25
stock-summary
ket_sd@kolsitegroup.com
Registrar Details
Sharex Dynamic (India) Pvt Ltd , Unit -1, Luthra Ind. Premises , Safed Pool, Andheri-Kurla Road, Andheri (E), Mumbai