
Compare Kabra Extrusion with Similar Stocks
Dashboard
Poor long term growth as Operating profit has grown by an annual rate -191.39% of over the last 5 years
The company has declared Negative results for the last 5 consecutive quarters
Risky - Negative Operating Profits
Despite the size of the company, domestic mutual funds hold only 0.03% of the company
Consistent Underperformance against the benchmark over the last 3 years
Stock DNA
Industrial Manufacturing
INR 844 Cr (Micro Cap)
NA (Loss Making)
38
1.06%
0.27
-1.17%
1.87
Total Returns (Price + Dividend) 
Latest dividend: 2.5 per share ex-dividend date: Jul-09-2025
Risk Adjusted Returns v/s
Returns Beta

News
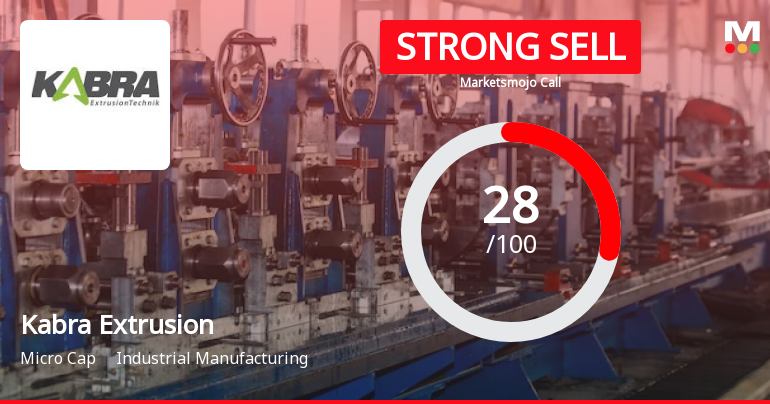
Kabra Extrusion Technik Ltd is Rated Strong Sell
Kabra Extrusion Technik Ltd is rated Strong Sell by MarketsMOJO. This rating was last updated on 29 September 2025, reflecting a reassessment of the company’s outlook. However, all fundamentals, returns, and financial metrics discussed below are current as of 15 June 2026, providing an up-to-date view of the stock’s position in today’s market.
Read full news article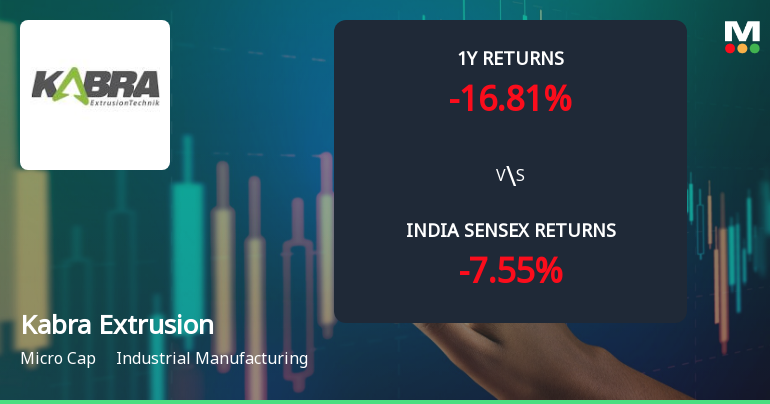
Kabra Extrusion Technik Ltd Sees Mixed Technical Signals Amid Sideways Momentum Shift
Kabra Extrusion Technik Ltd, a micro-cap player in the industrial manufacturing sector, has experienced a notable shift in its technical momentum, moving from a mildly bearish stance to a sideways trend. Despite a 3.53% gain on 15 Jun 2026, the stock’s technical indicators present a complex picture, with some signals suggesting mild bullishness while others remain neutral or bearish, reflecting uncertainty in near-term price direction.
Read full news article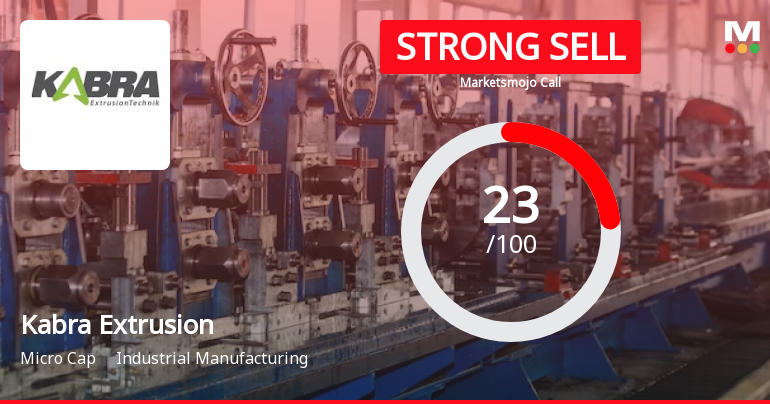
Kabra Extrusion Technik Ltd is Rated Strong Sell
Kabra Extrusion Technik Ltd is rated Strong Sell by MarketsMOJO, with this rating last updated on 29 September 2025. However, the analysis and financial metrics discussed here reflect the company’s current position as of 04 June 2026, providing investors with the latest insights into its performance and outlook.
Read full news article Announcements
Kabra Extrusion Technik Limited - Press Release
13-Nov-2019 | Source : NSEKabra Extrusion Technik Limited has informed the Exchange regarding a press release dated November 12, 2019, titled "Publication of Unaudited Financial Results for the quarter & half year ended September 30, 2019".
Disclosure under SEBI Takeover Regulations
23-Sep-2019 | Source : NSE
| Ekta A. Kabra has submitted to the?? Exchange a copy of Disclosure under Regulation 10(5) of SEBI (Substantial Acquisition of Shares and Takeovers) Regulations 2011. |
Press Release
02-Aug-2019 | Source : NSE
| Kabra Extrusion Technik Limited has informed the Exchange regarding a press release dated August 02, 2019, titled "Publication of Unaudited Financial Results for the quarter ended June 30, 2019 ". |
Corporate Actions

No Upcoming Board Meetings

Kabra Extrusion Technik Ltd has declared 50% dividend, ex-date: 09 Jul 25

Kabra Extrusion Technik Ltd has announced 5:10 stock split, ex-date: 17 May 10

Kabra Extrusion Technik Ltd has announced 1:1 bonus issue, ex-date: 06 Sep 10

No Rights history available
Quality key factors
Valuation key factors
Technicals key factors
 Technical Indicator Scale: Bearish, Mildly Bearish, Sideways, Mildly Bullish, Bullish Turned
 Shareholding Snapshot : Mar 2026
Shareholding Compare (%holding)
Promoters
None
Held by 2 Schemes (0.01%)
Held by 5 FIIs (0.35%)
Anand Shreevallabh Kabra (18.2%)
Seema Heinz Mathias (1.07%)
28.01%
Quarterly Results Snapshot (Consolidated) - Mar'26 - YoY

YoY Growth in quarter ended Mar 2026 is -13.90% vs -16.93% in Mar 2025
YoY Growth in quarter ended Mar 2026 is -36.29% vs -42.91% in Mar 2025
Half Yearly Results Snapshot (Consolidated) - Sep'25
Growth in half year ended Sep 2025 is 2.05% vs -31.60% in Sep 2024

Growth in half year ended Sep 2025 is -150.77% vs 25.79% in Sep 2024
Nine Monthly Results Snapshot (Consolidated) - Dec'25
YoY Growth in nine months ended Dec 2025 is -1.90% vs -23.32% in Dec 2024
YoY Growth in nine months ended Dec 2025 is -157.34% vs 43.97% in Dec 2024
Annual Results Snapshot (Consolidated) - Mar'26
YoY Growth in year ended Mar 2026 is -5.41% vs -21.54% in Mar 2025
YoY Growth in year ended Mar 2026 is -116.68% vs -4.79% in Mar 2025
About Kabra Extrusion Technik Ltd

Company Coordinates


