
Compare Kaizen Agro with Similar Stocks
Dashboard
With a Operating Losses, the company has a Weak Long Term Fundamental Strength
- Poor long term growth as Operating profit has grown by an annual rate 8.73% of over the last 5 years
- Company's ability to service its debt is weak with a poor EBIT to Interest (avg) ratio of 0.41
Flat results in Mar 26
With ROE of 0.3, it has a Very Expensive valuation with a 0.4 Price to Book Value
Consistent Underperformance against the benchmark over the last 3 years
Total Returns (Price + Dividend) 
Kaizen Agro for the last several years.
Risk Adjusted Returns v/s
Returns Beta

News
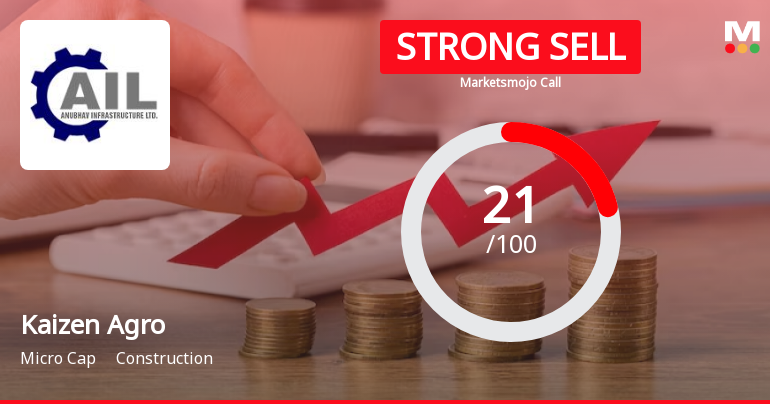
Kaizen Agro Infrabuild Ltd is Rated Strong Sell
Kaizen Agro Infrabuild Ltd is rated Strong Sell by MarketsMOJO. This rating was last updated on 29 May 2026, reflecting a significant reassessment of the stock’s outlook. However, the analysis and financial metrics presented here are based on the company’s current position as of 04 June 2026, providing investors with the latest data to understand the rationale behind this recommendation.
Read full news article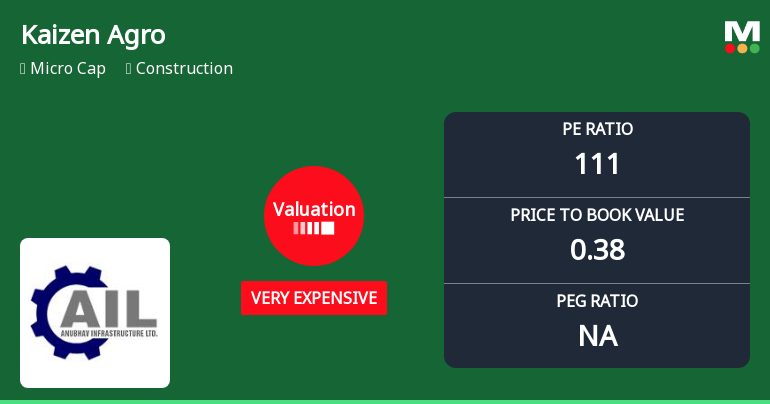
Kaizen Agro Infrabuild Ltd Valuation Shifts Signal Heightened Price Risk
Kaizen Agro Infrabuild Ltd, a micro-cap player in the construction sector, has seen a marked shift in its valuation parameters, moving from a previously attractive price point to a very expensive territory. This change, coupled with deteriorating financial metrics and a recent downgrade to a Strong Sell rating, raises significant concerns about the stock’s price attractiveness and risk profile for investors.
Read full news article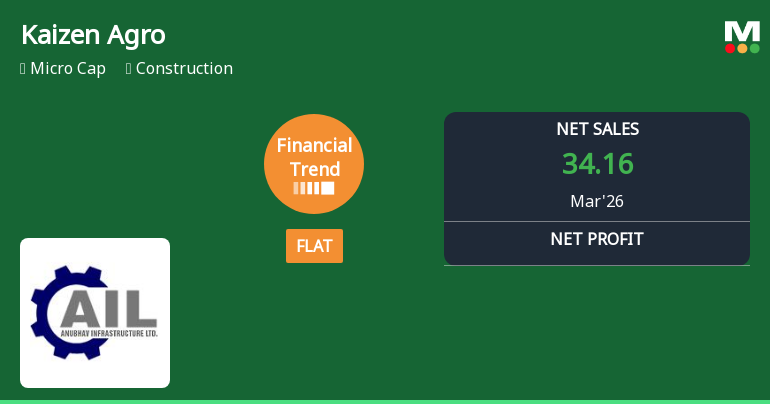
Kaizen Agro Infrabuild Ltd Reports Flat Quarterly Performance Amid Sharp Profit Decline
Kaizen Agro Infrabuild Ltd, a micro-cap player in the construction sector, has reported a flat financial performance for the quarter ended March 2026, signalling a sharp deceleration from its previously very positive growth trajectory. Despite higher net sales, the company’s profitability metrics have deteriorated significantly, raising concerns about margin pressures and cash flow constraints.
Read full news article Announcements
Announcement under Regulation 30 (LODR)-Newspaper Publication
01-Jun-2026 | Source : BSENewspaper Publication- Audited Financial result of the Company for the quarter and ended 31st March 2026.
Announcement under Regulation 30 (LODR)-Change in Management
29-May-2026 | Source : BSEChange in Management
Results- Financial Result For 31St March 2026
29-May-2026 | Source : BSEApproval of Audited of Financial result 31st March 2026
Corporate Actions

No Upcoming Board Meetings

No Dividend history available

No Splits history available

No Bonus history available

No Rights history available
Quality key factors
Valuation key factors
Technicals key factors
 Technical Indicator Scale: Bearish, Mildly Bearish, Sideways, Mildly Bullish, Bullish Turned
 Shareholding Snapshot : Mar 2026
Shareholding Compare (%holding)
Non Institution
None
Held by 0 Schemes
Held by 1 FIIs (9.72%)
Parmeshwar Mercantile Private Limited (23.7%)
Multitude Growth Funds Limited (9.72%)
13.48%
Quarterly Results Snapshot (Standalone) - Mar'26 - YoY

YoY Growth in quarter ended Mar 2026 is 1,353.62% vs -85.36% in Mar 2025

YoY Growth in quarter ended Mar 2026 is -808.70% vs 109.09% in Mar 2025
Half Yearly Results Snapshot (Standalone) - Sep'25
Growth in half year ended Sep 2025 is 170.84% vs -36.47% in Sep 2024
Growth in half year ended Sep 2025 is 317.65% vs 187.18% in Sep 2024
Nine Monthly Results Snapshot (Standalone) - Dec'25
YoY Growth in nine months ended Dec 2025 is 114.83% vs 6.06% in Dec 2024
YoY Growth in nine months ended Dec 2025 is 1,156.25% vs 45.45% in Dec 2024
Annual Results Snapshot (Standalone) - Mar'26
YoY Growth in year ended Mar 2026 is 257.32% vs -39.46% in Mar 2025
YoY Growth in year ended Mar 2026 is -5.13% vs 290.00% in Mar 2025
About Kaizen Agro Infrabuild Ltd

Company Coordinates


