
Compare Kalpa Commer. with Similar Stocks
Dashboard
With a Operating Losses, the company has a Weak Long Term Fundamental Strength
- Poor long term growth as Operating profit has grown by an annual rate 16.43% of over the last 5 years
- Low ability to service debt as the company has a high Debt to EBITDA ratio of 75.22 times
With ROCE of 0.8, it has a Expensive valuation with a 0.9 Enterprise value to Capital Employed
Total Returns (Price + Dividend) 
Kalpa Commer. for the last several years.
Risk Adjusted Returns v/s
Returns Beta

News
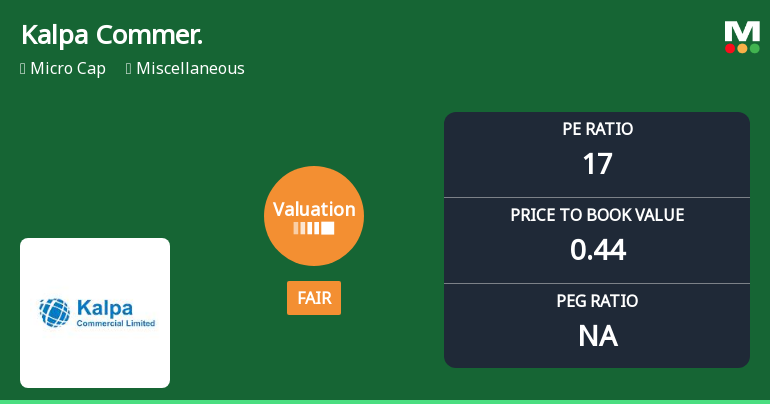
Kalpa Commercial Ltd Valuation Shifts Amid Market Rally
Kalpa Commercial Ltd has witnessed a notable shift in its valuation parameters, moving from an attractive to a fair rating, as its price-to-earnings (P/E) and price-to-book value (P/BV) ratios adjust in the context of recent market gains and peer comparisons. Despite a strong rally in its share price, the micro-cap company’s financial metrics and relative valuation suggest a more cautious outlook for investors.
Read full news article
Kalpa Commercial Ltd Downgraded to Strong Sell Amid Bearish Technicals and Weak Fundamentals
Kalpa Commercial Ltd has seen its investment rating downgraded from Sell to Strong Sell as of 2 June 2026, reflecting deteriorating technical indicators and ongoing fundamental challenges despite some valuation improvements. The micro-cap stock’s Mojo Score fell to 29.0, signalling heightened caution for investors amid a complex interplay of quality, valuation, financial trends, and technical factors.
Read full news article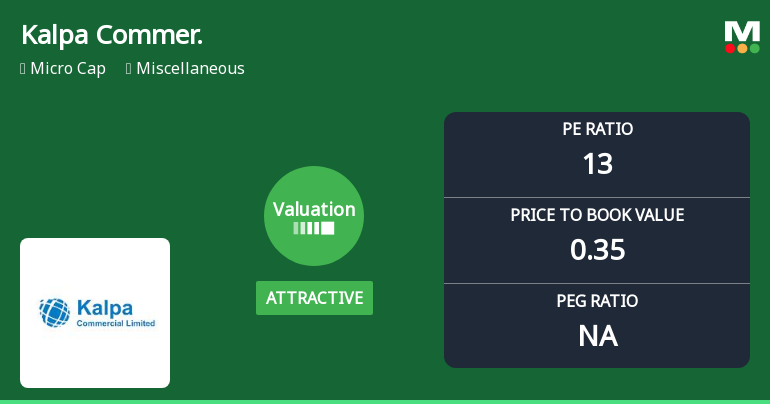
Kalpa Commercial Ltd Valuation Shifts Signal Deteriorating Price Attractiveness
Kalpa Commercial Ltd has experienced a notable shift in its valuation parameters, with its price-to-earnings (P/E) and price-to-book value (P/BV) ratios moving away from historically attractive levels. Despite a recent downgrade to a Strong Sell rating by MarketsMOJO, the micro-cap stock’s valuation metrics now place it in a less favourable light compared to its peers and its own past performance, raising concerns about its price attractiveness for investors.
Read full news article Announcements
Compliances-Reg.24(A)-Annual Secretarial Compliance
30-May-2026 | Source : BSEAnnual secretrial Compliance Report for the Financial Year ended on 31st March 2026.
Results-FY 2025-26
30-May-2026 | Source : BSEFinancial Result for the Quarter and Year ended on 31st March 2026
Board Meeting Outcome for Announcement Of Outcome Of Board Meeting Pursuant To Regulation 30 And Regulation 33 Of The Securities And Exchange Board Of India (Listing Obligations And Disclosure Requirements) Regulation 2015 As Amended (SEBI LODR Regulatio
30-May-2026 | Source : BSEThe audited standalone Financial Result of the Company for the Quarter and Year ended 31st March 2026 as considered approved and taken on record by the Board of Director of the Company along with the Limited Review Report issued by the Statutory Auditor
Corporate Actions

No Upcoming Board Meetings

No Dividend history available

No Splits history available

No Bonus history available

No Rights history available
Quality key factors
Valuation key factors
Technicals key factors
 Technical Indicator Scale: Bearish, Mildly Bearish, Sideways, Mildly Bullish, Bullish Turned
 Shareholding Snapshot : Mar 2026
Shareholding Compare (%holding)
Non Institution
None
Held by 0 Schemes
Held by 0 FIIs
Angoori Devi Aggarwal (9.76%)
Abhishek Ashoka (7.64%)
72.17%
Quarterly Results Snapshot (Standalone) - Mar'26 - YoY
Not Applicable: The company has declared_date for only one period
Not Applicable: The company has declared_date for only one period
Half Yearly Results Snapshot (Standalone) - Sep'25
Not Applicable: The company has declared_date for only one period
Not Applicable: The company has declared_date for only one period
Nine Monthly Results Snapshot (Standalone) - Dec'25
Not Applicable: The company has declared_date for only one period
Not Applicable: The company has declared_date for only one period
Annual Results Snapshot (Standalone) - Mar'26

YoY Growth in year ended Mar 2026 is 1,018.86% vs 0.00% in Mar 2025
YoY Growth in year ended Mar 2026 is 122.63% vs -13,800.00% in Mar 2025
About Kalpa Commercial Ltd

Kalpa commercial (KCL), established in 1985 has earned a reputation of the most well equipped store for all garments, fabrics, cloths consumer electronics and luxury products at competitive pricing with the added benefit of a customer friendly environment. The company strives to provide the latest technology and luxury brands at affordable prices to all its customers. The company’s core competency is its customer relationship. The company has built a trust with its everyday co
Company Coordinates


