
Compare Kalpataru Proj. with Similar Stocks
Dashboard
With a growth in Net Profit of 188.9%, the company declared Very Positive results in Mar 26
- The company has declared positive results for the last 5 consecutive quarters
- ROCE(HY) Highest at 16.21%
- OPERATING PROFIT TO INTEREST(Q) Highest at 6.12 times
- CASH AND CASH EQUIVALENTS(HY) Highest at Rs 1,842.19 cr
With ROCE of 18.3, it has a Very Attractive valuation with a 2.5 Enterprise value to Capital Employed
High Institutional Holdings at 56.03%
Market Beating performance in long term as well as near term
With its market cap of Rs 22,115 cr, it is the second biggest company in the sector (behind PTC Industries)and constitutes 27.88% of the entire sector
Stock DNA
Construction
INR 23,273 Cr (Small Cap)
22.00
32
0.70%
0.22
12.89%
2.84
Total Returns (Price + Dividend) 
Latest dividend: 9 per share ex-dividend date: Jun-23-2025
Risk Adjusted Returns v/s
Returns Beta

News
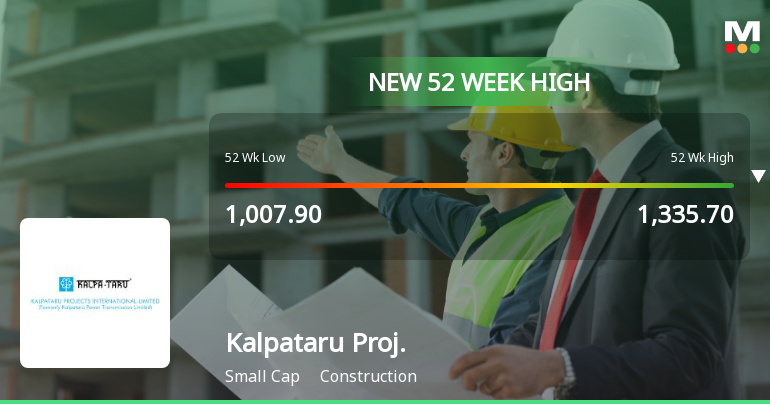
Broad-Based Technical Strength Lifts Kalpataru Projects International Ltd to 52-Week High of Rs 1345
Surging to an intraday peak of Rs 1345 on 16 Jun 2026, Kalpataru Projects International Ltd has marked a fresh 52-week high, propelled by a confluence of robust technical signals and sustained price momentum that outpaces its sector and the broader market.
Read full news article
Kalpataru Projects International Ltd Technical Momentum Shifts Signal Strong Buy
Kalpataru Projects International Ltd, a small-cap player in the construction sector, has recently experienced a nuanced shift in its technical momentum. While the company’s MarketsMOJO score has improved to a strong buy rating of 80.0 from a previous hold, its technical indicators present a blend of bullish and mildly bearish signals, reflecting a complex market sentiment as it trades near its 52-week high.
Read full news article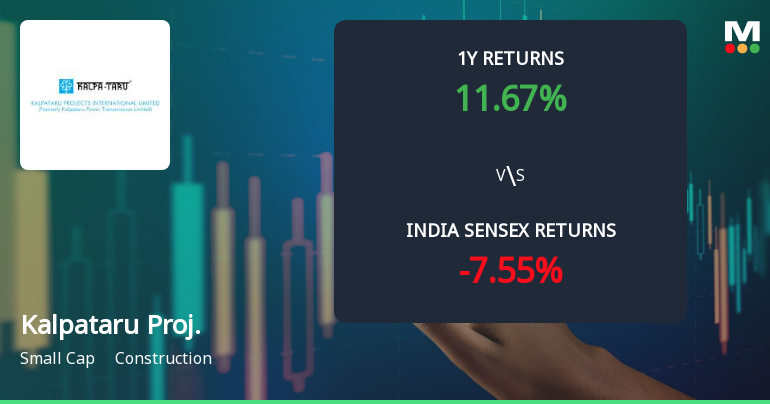
Kalpataru Projects International Ltd Technical Momentum Shifts Signal Bullish Outlook
Kalpataru Projects International Ltd has demonstrated a notable shift in technical momentum, with key indicators signalling a bullish trend. The stock’s recent upgrade to a Strong Buy rating by MarketsMOJO, coupled with positive price action and improving technical parameters, suggests growing investor confidence in this small-cap construction sector player.
Read full news article Announcements
Announcement under Regulation 30 (LODR)-Change in Directorate
09-Jun-2026 | Source : BSEThe Board has approved the appointment of Mr. Gautam Mehra (DIN: 11700652) as an Additional Director designated as an Independent Director subject to approval of shareholders of the Company
Outcome Of Board Meeting Held On 09Th June 2026
09-Jun-2026 | Source : BSEOutcome of Board Meeting held on 09th June 2026
Disclosure Under Regulation 30 Of Securities And Exchange Board Of India (Listing Obligations And Disclosure Requirements) Regulations 2015
08-Jun-2026 | Source : BSEDisclosure under Regulation 30 of Securities and Exchange Board of India (Listing Obligations and Disclosure Requirements) Regulation 2015
Corporate Actions

No Upcoming Board Meetings

Kalpataru Projects International Ltd has declared 450% dividend, ex-date: 23 Jun 25

Kalpataru Projects International Ltd has announced 2:10 stock split, ex-date: 08 Sep 10

Kalpataru Projects International Ltd has announced 1:1 bonus issue, ex-date: 13 Apr 06

No Rights history available
Quality key factors
Valuation key factors
Technicals key factors
 Technical Indicator Scale: Bearish, Mildly Bearish, Sideways, Mildly Bullish, Bullish Turned
 Shareholding Snapshot : Mar 2026
Shareholding Compare (%holding)
Mutual Funds
24.5456
Held by 23 Schemes (40.41%)
Held by 163 FIIs (10.92%)
K C Holdings Pvt Ltd (12.17%)
Sbi Small Cap Fund (9.1%)
8.17%
Quarterly Results Snapshot (Consolidated) - Mar'26 - QoQ

QoQ Growth in quarter ended Mar 2026 is 16.69% vs 2.10% in Dec 2025
QoQ Growth in quarter ended Mar 2026 is 185.35% vs -36.61% in Dec 2025
Half Yearly Results Snapshot (Consolidated) - Sep'25
Growth in half year ended Sep 2025 is 33.45% vs 8.64% in Sep 2024
Growth in half year ended Sep 2025 is 107.79% vs 6.96% in Sep 2024
Nine Monthly Results Snapshot (Consolidated) - Dec'25
YoY Growth in nine months ended Dec 2025 is 26.99% vs 11.67% in Dec 2024
YoY Growth in nine months ended Dec 2025 is 68.15% vs 4.40% in Dec 2024
Annual Results Snapshot (Consolidated) - Mar'26
YoY Growth in year ended Mar 2026 is 21.63% vs 13.70% in Mar 2025
YoY Growth in year ended Mar 2026 is 77.57% vs 14.93% in Mar 2025
About Kalpataru Projects International Ltd

Company Coordinates


