
Compare Kalyani Invest. with Similar Stocks
Stock DNA
Non Banking Financial Company (NBFC)
INR 2,155 Cr (Small Cap)
60.00
20
0.00%
0.00
0.32%
0.19
Total Returns (Price + Dividend) 
Kalyani Invest. for the last several years.
Risk Adjusted Returns v/s
Returns Beta

News
Kalyani Investment Company Ltd is Rated Sell
Kalyani Investment Company Ltd is rated 'Sell' by MarketsMOJO, with this rating last updated on 26 May 2026. However, the analysis and financial metrics discussed here reflect the stock's current position as of 09 June 2026, providing investors with the latest insights into the company’s performance and outlook.
Read full news article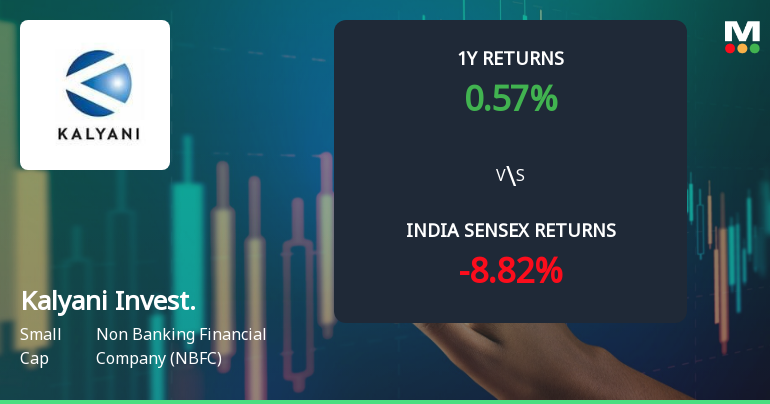
Kalyani Investment Company Ltd Technical Momentum Shifts Amid Sideways Trend
Kalyani Investment Company Ltd, a small-cap player in the Non Banking Financial Company (NBFC) sector, has experienced a notable shift in its technical momentum. Despite a recent downgrade in its Mojo Grade from Strong Sell to Sell, the stock exhibits a complex blend of bullish and bearish signals across key technical indicators, reflecting a sideways trend after a mildly bullish phase.
Read full news article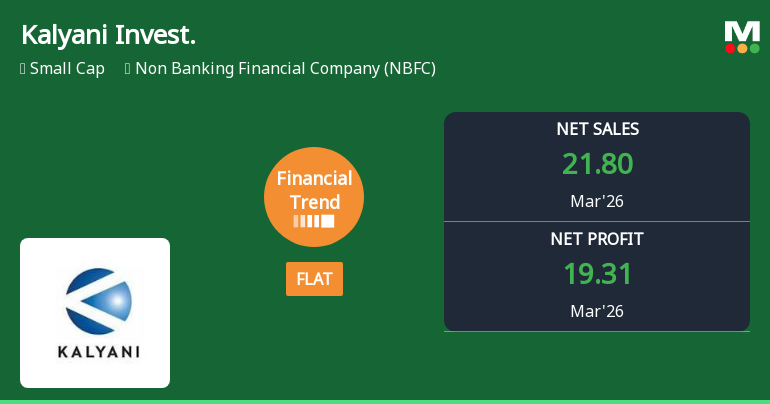
Kalyani Investment Company Ltd Reports Stabilised Financial Trend Amid Mixed Quarterly Results
Kalyani Investment Company Ltd has reported a stabilisation in its financial performance for the quarter ended March 2026, shifting from a previously negative trend to a flat trajectory. Despite challenges in recent periods, the company posted notable growth in profit before tax and net profit for the quarter, signalling a potential turnaround in its operational momentum.
Read full news article Announcements
Announcement under Regulation 30 (LODR)-Newspaper Publication
01-Jun-2026 | Source : BSEAnnouncement U/R 30 of SEBI LODR-Newspaper Publication-Audited Results-31-03-2026
Board Meeting Outcome for Audited Financial Results (Standalone And Consolidated) For The Quarter And Year Ended March 31 2026 & Recommendation Of Dividend For FY 2025-26
29-May-2026 | Source : BSEAudited Financial Results (Standalone and Consolidated) for the quarter and year ended March 31 2026 and Recommendation of Dividend for FY 2025-26
Corporate Actions

No Upcoming Board Meetings

No Dividend history available

No Splits history available

No Bonus history available

No Rights history available
Quality key factors
Valuation key factors
Technicals key factors
 Technical Indicator Scale: Bearish, Mildly Bearish, Sideways, Mildly Bullish, Bullish Turned
 Shareholding Snapshot : Mar 2026
Shareholding Compare (%holding)
Promoters
None
Held by 5 Schemes (0.0%)
Held by 7 FIIs (0.65%)
Sundaram Trading & Investment Private Limited (60.94%)
Oleander Investment Pvt Ltd (1.08%)
18.63%
Quarterly Results Snapshot (Consolidated) - Mar'26 - QoQ

QoQ Growth in quarter ended Mar 2026 is 233.33% vs -85.11% in Dec 2025
QoQ Growth in quarter ended Mar 2026 is 1,029.24% vs -90.97% in Dec 2025
Half Yearly Results Snapshot (Consolidated) - Sep'25

Growth in half year ended Sep 2025 is -2.83% vs 21.35% in Sep 2024
Growth in half year ended Sep 2025 is -63.06% vs 22.53% in Sep 2024
Nine Monthly Results Snapshot (Consolidated) - Dec'25
YoY Growth in nine months ended Dec 2025 is -0.93% vs 22.06% in Dec 2024
YoY Growth in nine months ended Dec 2025 is -61.94% vs 12.21% in Dec 2024
Annual Results Snapshot (Consolidated) - Mar'26
YoY Growth in year ended Mar 2026 is -0.22% vs 17.08% in Mar 2025
YoY Growth in year ended Mar 2026 is -48.60% vs 2.13% in Mar 2025
About Kalyani Investment Company Ltd

Company Coordinates


