
Compare Kalyani Steels with Similar Stocks
Dashboard
Company has a Debt to Equity ratio (avg) of 0.01 times
Poor long term growth as Net Sales has grown by an annual rate of 9.21% and Operating profit at 6.77% over the last 5 years
Flat results in Mar 26
With ROE of 12.4, it has a Fair valuation with a 1.7 Price to Book Value
Majority shareholders : Promoters
Stock DNA
Iron & Steel Products
INR 3,482 Cr (Small Cap)
13.00
26
1.24%
-0.14
12.43%
1.68
Total Returns (Price + Dividend) 
Latest dividend: 10 per share ex-dividend date: Aug-11-2025
Risk Adjusted Returns v/s
Returns Beta

News
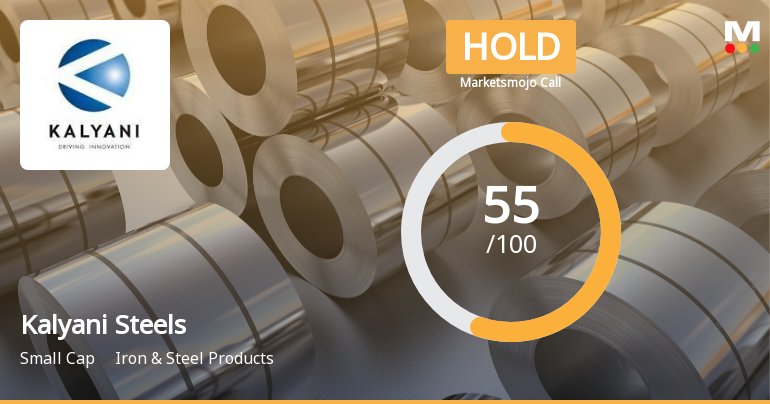
Kalyani Steels Ltd Upgraded to Hold by MarketsMOJO on Technical Improvements
Kalyani Steels Ltd has seen its investment rating upgraded from Sell to Hold as of 8 June 2026, reflecting a nuanced improvement across technical indicators, valuation, and financial trends despite a flat quarterly performance. The company’s evolving market dynamics and long-term returns relative to the Sensex underpin this reassessment.
Read full news article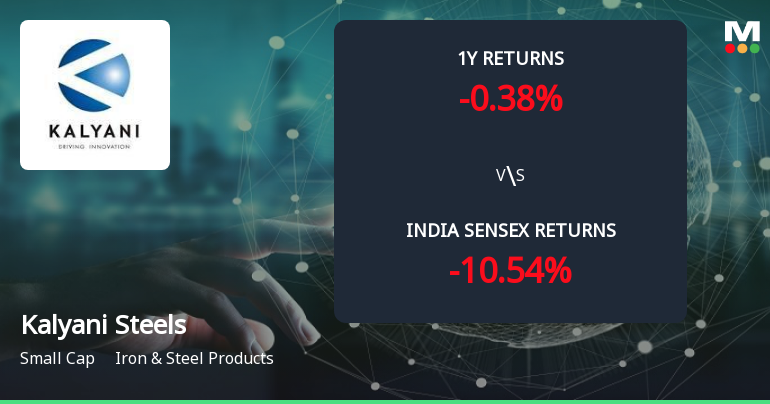
Kalyani Steels Ltd Forms Golden Cross Amid Mixed Technical Signals and Declining Short-Term Momentum
The 50-day moving average for Kalyani Steels Ltd has crossed above the 200-day moving average, creating a golden cross on 8 Jun 2026. Yet, the stock declined 1.98% on the day of the crossover, and monthly technical indicators remain mildly bearish, presenting a complex picture that demands a closer look at the signal's reliability.
Read full news article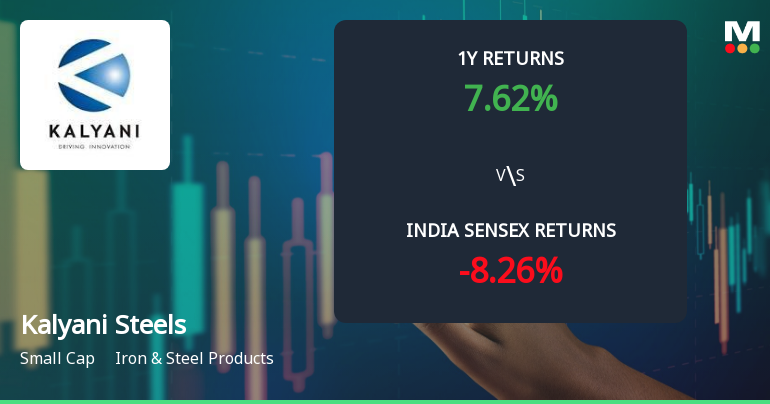
Kalyani Steels Ltd Technical Momentum Shifts Amid Mixed Indicator Signals
Kalyani Steels Ltd has exhibited a notable shift in price momentum, transitioning from a sideways trend to a mildly bullish stance as of early June 2026. Despite this positive technical tilt, the stock’s overall MarketsMOJO grade has been downgraded from Hold to Sell, reflecting a complex interplay of bullish and bearish signals across key technical indicators.
Read full news article Announcements
Compliances-Reg.24(A)-Annual Secretarial Compliance
25-May-2026 | Source : BSERegulation 24(A) of SEBI LODR-Annual Secretarial Compliance Report for the year ended March 31 2026
Announcement under Regulation 30 (LODR)-Newspaper Publication
20-May-2026 | Source : BSEAnnouncement U/R 30 of SEBI LODR-Newspaper Publication-Notice of Postal Ballot
Shareholder Meeting / Postal Ballot-Notice of Postal Ballot
19-May-2026 | Source : BSENotice of Postal Ballot
Corporate Actions

No Upcoming Board Meetings

Kalyani Steels Ltd has declared 200% dividend, ex-date: 11 Aug 25

No Splits history available

No Bonus history available

No Rights history available
Quality key factors
Valuation key factors
Technicals key factors
 Technical Indicator Scale: Bearish, Mildly Bearish, Sideways, Mildly Bullish, Bullish Turned
 Shareholding Snapshot : Mar 2026
Shareholding Compare (%holding)
Promoters
None
Held by 6 Schemes (11.05%)
Held by 47 FIIs (1.82%)
Bf Investment Limited (39.06%)
Quant Mutual Fund A/c Quant Infrastructure Fund (5.99%)
17.13%
Quarterly Results Snapshot (Standalone) - Mar'26 - QoQ

QoQ Growth in quarter ended Mar 2026 is 4.76% vs 1.38% in Dec 2025
QoQ Growth in quarter ended Mar 2026 is 15.83% vs -0.81% in Dec 2025
Half Yearly Results Snapshot (Consolidated) - Sep'25
Not Applicable: The company has declared_date for only one period
Not Applicable: The company has declared_date for only one period
Nine Monthly Results Snapshot (Consolidated) - Dec'25

YoY Growth in nine months ended Dec 2025 is -5.31% vs 14.34% in Dec 2024
YoY Growth in nine months ended Dec 2025 is 5.76% vs 0.88% in Dec 2024
Annual Results Snapshot (Consolidated) - Mar'26
YoY Growth in year ended Mar 2026 is -6.88% vs 1.14% in Mar 2025
YoY Growth in year ended Mar 2026 is 0.63% vs 3.00% in Mar 2025
About Kalyani Steels Ltd

Company Coordinates


