
Compare Kama Holdings with Similar Stocks
Stock DNA
Holding Company
INR 8,309 Cr (Small Cap)
8.00
20
0.00%
0.63
12.63%
1.02
Total Returns (Price + Dividend) 
Latest dividend: 82 per share ex-dividend date: Aug-31-2023
Risk Adjusted Returns v/s
Returns Beta

News

Kama Holdings Ltd is Rated Sell by MarketsMOJO
Kama Holdings Ltd is rated Sell by MarketsMOJO, with this rating last updated on 01 June 2026. However, the analysis and financial metrics discussed below reflect the stock’s current position as of 08 June 2026, providing investors with the most up-to-date view of the company’s fundamentals, returns, and technical outlook.
Read full news article
Kama Holdings Ltd is Rated Sell by MarketsMOJO
Kama Holdings Ltd is rated 'Sell' by MarketsMOJO, with this rating last updated on 01 June 2026. However, the analysis and financial metrics discussed below reflect the stock's current position as of 08 June 2026, providing investors with an up-to-date view of the company’s fundamentals, returns, and technical outlook.
Read full news article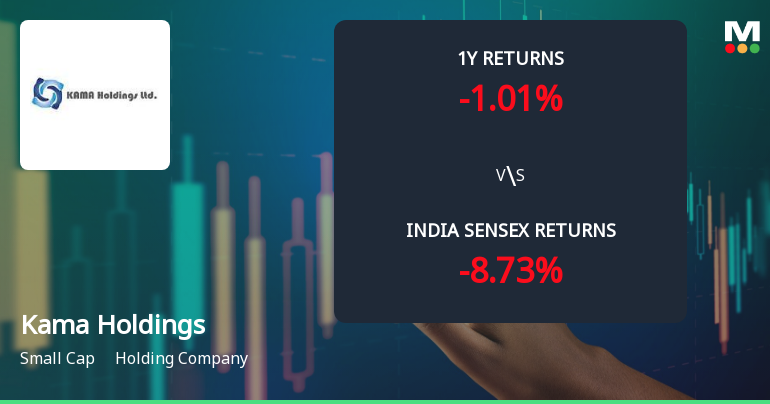
Kama Holdings Ltd Technical Momentum Shifts Amid Mixed Market Signals
Kama Holdings Ltd, a small-cap holding company, has experienced a subtle but notable shift in its technical momentum, moving from a sideways trend to a mildly bearish stance. Despite a recent downgrade from Hold to Sell by MarketsMOJO, the stock’s mixed technical indicators present a nuanced picture for investors navigating the current market environment.
Read full news article Announcements
Announcement under Regulation 30 (LODR)-Newspaper Publication
26-May-2026 | Source : BSENewspaper Clippings of Audited Financial Results
Audited Financial Results (Standalone & Consolidated) For The Quarter And The Year Ended 31.03.2026 And Outcome Of Board Meeting
25-May-2026 | Source : BSEAudited Financial Results
Board Meeting Intimation for Intimation Under Regulation 29 Of SEBI (Listing Obligations And Disclosure Requirements) Regulations 2015 - Notice Of Board Meeting For Audited Financial Results For Quarter And Year Ended 31St March 2026
18-May-2026 | Source : BSEKama Holdings Ltd-has informed BSE that the meeting of the Board of Directors of the Company is scheduled on 25/05/2026 inter alia to consider and approve A meeting of the Board of Directors is scheduled to be held on Monday the 25th May 2026 for inter-alia: - considering and approving the audited financial results for the quarter and year ended 31st March 2026. - recommendation of final dividend on equity shares if any. Pursuant to the Code of Conduct to Regulate Monitor and Report Trading by Insiders framed in accordance with the Securities & Exchange Board of India (Prohibition of Insider Trading) Regulations 2015 the window for trading in the shares of the Company by the Designated Persons & Directors will remain closed between Wednesday 1st April 2026 to Wednesday 27th May 2026 (both days inclusive).
Corporate Actions

No Upcoming Board Meetings

Kama Holdings Ltd has declared 232% dividend, ex-date: 20 Mar 26

No Splits history available

Kama Holdings Ltd has announced 4:1 bonus issue, ex-date: 17 Oct 23

No Rights history available
Quality key factors
Valuation key factors
Technicals key factors
 Technical Indicator Scale: Bearish, Mildly Bearish, Sideways, Mildly Bullish, Bullish Turned
 Shareholding Snapshot : Mar 2026
Shareholding Compare (%holding)
Promoters
None
Held by 1 Schemes (0.0%)
Held by 10 FIIs (0.24%)
Abr Family Trust Through Its Trustees Ashish Bharat Ram And Kartik Bharat Ram (75.0%)
Vistra Itcl (india) Limited (5.95%)
7.54%
Quarterly Results Snapshot (Consolidated) - Mar'26 - YoY

YoY Growth in quarter ended Mar 2026 is 7.07% vs 14.61% in Mar 2025

YoY Growth in quarter ended Mar 2026 is 10.96% vs -35.33% in Mar 2025
Half Yearly Results Snapshot (Consolidated) - Sep'25
Growth in half year ended Sep 2025 is 8.29% vs 5.84% in Sep 2024
Growth in half year ended Sep 2025 is 82.35% vs -31.47% in Sep 2024
Nine Monthly Results Snapshot (Consolidated) - Dec'25
YoY Growth in nine months ended Dec 2025 is 7.58% vs 8.64% in Dec 2024
YoY Growth in nine months ended Dec 2025 is 73.65% vs -20.95% in Dec 2024
Annual Results Snapshot (Consolidated) - Mar'26
YoY Growth in year ended Mar 2026 is 7.43% vs 10.33% in Mar 2025
YoY Growth in year ended Mar 2026 is 47.33% vs -27.70% in Mar 2025
About Kama Holdings Ltd

Company Coordinates


