
Compare Kandenko Co., Ltd. with Similar Stocks
Dashboard
1
Company has very low debt and has enough cash to service the debt requirements
2
Poor long term growth as Net Sales has grown by an annual rate of 1.75% and Operating profit at 10.95% over the last 5 years
3
Flat results in Jun 25
4
With ROE of 12.38%, it has a very attractive valuation with a 1.66 Price to Book Value
5
Consistent Returns over the last 3 years
Total Returns (Price + Dividend) 
TimePeriod
Price Return
Dividend Return
Total Return
3 Months
118.37%
0%
118.37%
6 Months
159.49%
0%
159.49%
1 Year
226.32%
0%
226.32%
2 Years
423.48%
0%
423.48%
3 Years
588.98%
0%
588.98%
4 Years
532.2%
0%
532.2%
5 Years
491.26%
0%
491.26%
Kandenko Co., Ltd. for the last several years.
Risk Adjusted Returns v/s
News
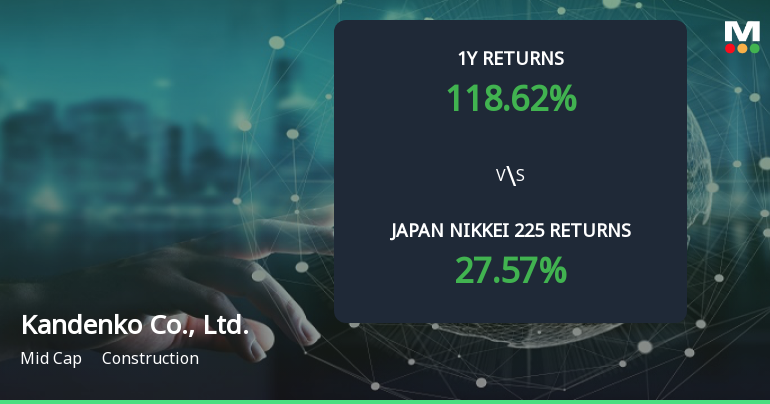
Kandenko Co., Ltd. Achieves 118.62% Return, Establishing It as a Multibagger in Construction Sector
Kandenko Co., Ltd. has recently undergone a revision in its score, reflecting its impressive performance and solid financial foundation. With a remarkable return of 118.62% over the past year, the company continues to outperform the Japan Nikkei 225, showcasing its operational efficiency and growth potential in the construction sector.
Read full news article Announcements

No announcement available
Corporate Actions
No corporate action available
Quality key factors
Factor
Value
Sales Growth (5y)
1.75%
EBIT Growth (5y)
10.95%
EBIT to Interest (avg)
100.00
Debt to EBITDA (avg)
0
Net Debt to Equity (avg)
-0.11
Sales to Capital Employed (avg)
1.74
Tax Ratio
29.05%
Dividend Payout Ratio
39.55%
Pledged Shares
0
Institutional Holding
0.16%
ROCE (avg)
14.44%
ROE (avg)
8.76%
Valuation key factors
Factor
Value
P/E Ratio
13
Industry P/E
Price to Book Value
1.66
EV to EBIT
9.83
EV to EBITDA
8.42
EV to Capital Employed
1.74
EV to Sales
0.85
PEG Ratio
0.19
Dividend Yield
0.05%
ROCE (Latest)
17.72%
ROE (Latest)
12.38%
Technicals key factors
Indicator
Weekly
Monthly
MACD
Bullish
Bullish
RSI
No Signal
Bearish
Bollinger Bands
Bullish
Bullish
Moving Averages
Bullish (Daily)
KST
Mildly Bearish
Bullish
Dow Theory
No Trend
No Trend
OBV
No Trend
No Trend
 Technical Indicator Scale: Bearish, Mildly Bearish, Sideways, Mildly Bullish, Bullish Turned
 Shareholding Snapshot : Sep 2018
Shareholding Compare (%holding)
Majority shareholders
Strategic Entities
Domestic Funds
Held in 0 Schemes (0%)
Foreign Institutions
Held by 0 Foreign Institutions (0%)
Strategic Entities with highest holding
Highest Public shareholder
Quarterly Results Snapshot (Consolidated) - Sep'25 - YoY
Sep'25
Sep'24
Change(%)
Net Sales
175,071.00
157,876.00
10.89%
Operating Profit (PBDIT) excl Other Income
23,072.00
17,454.00
32.19%
Interest
46.00
42.00
9.52%
Exceptional Items
-13.00
-41.00
68.29%
Consolidate Net Profit
14,338.00
10,153.00
41.22%
Operating Profit Margin (Excl OI)
116.70%
95.50%
2.12%
USD in Million.

Net Sales
YoY Growth in quarter ended Sep 2025 is 10.89% vs 10.37% in Sep 2024

Consolidated Net Profit
YoY Growth in quarter ended Sep 2025 is 41.22% vs 64.96% in Sep 2024
Annual Results Snapshot (Consolidated) - Mar'25
Mar'25
Mar'24
Change(%)
Net Sales
671,888.00
598,427.00
12.28%
Operating Profit (PBDIT) excl Other Income
68,061.00
49,795.00
36.68%
Interest
232.00
214.00
8.41%
Exceptional Items
-2,265.00
2,929.00
-177.33%
Consolidate Net Profit
43,732.00
29,138.00
50.09%
Operating Profit Margin (Excl OI)
86.80%
68.40%
1.84%
USD in Million.
Net Sales
YoY Growth in year ended Mar 2025 is 12.28% vs 10.50% in Mar 2024
Consolidated Net Profit
YoY Growth in year ended Mar 2025 is 50.09% vs 33.61% in Mar 2024
About Kandenko Co., Ltd.

Kandenko Co., Ltd.
Construction
No Details Available.
Company Coordinates
No Company Details Available
InfinHub Market Technologies FZ-LLC, Building-2, Unit 112, Dubai Internet City, Dubai, United Arab Emirates
GET THE MARKETSMOJO APP


Company
Stocks
Portfolio


"Investment in securities markets are subject to market risk. Read all the related documents carefully before investing."