
Compare Kanpur Plastipa. with Similar Stocks
Dashboard
Weak Long Term Fundamental Strength with an average Return on Capital Employed (ROCE) of 7.60%
- Poor long term growth as Net Sales has grown by an annual rate of 9.67% and Operating profit at 2.16% over the last 5 years
- Low ability to service debt as the company has a high Debt to EBITDA ratio of 1.78 times
With a growth in Net Profit of 39.76%, the company declared Very Positive results in Mar 26
With ROCE of 13.8, it has a Attractive valuation with a 1.6 Enterprise value to Capital Employed
Despite the size of the company, domestic mutual funds hold only 0% of the company
Total Returns (Price + Dividend) 
Latest dividend: 0.9 per share ex-dividend date: Sep-01-2025
Risk Adjusted Returns v/s
Returns Beta

News
When is the next results date for Kanpur Plastipack Ltd?
The next results date for Kanpur Plastipack Ltd is scheduled for July 27, 2026....
Read full news article
Kanpur Plastipack Ltd Upgraded to Hold as Technicals Improve and Financials Strengthen
Kanpur Plastipack Ltd, a micro-cap player in the packaging sector, has seen its investment rating upgraded from Sell to Hold, reflecting a notable improvement in its technical indicators and robust financial results for Q4 FY25-26. The upgrade, announced on 13 July 2026, is underpinned by a combination of enhanced technical trends, attractive valuation metrics, positive financial performance, and a cautiously optimistic outlook on the company’s quality parameters.
Read full news article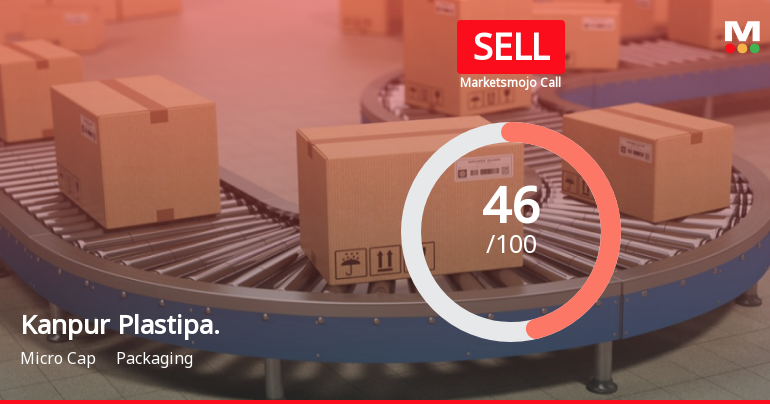
Kanpur Plastipack Ltd Downgraded to Sell Amid Mixed Financial and Technical Signals
Kanpur Plastipack Ltd, a micro-cap player in the packaging sector, has seen its investment rating downgraded from Hold to Sell as of 8 July 2026. This shift reflects a nuanced assessment across four critical parameters: quality, valuation, financial trend, and technicals. Despite recent positive quarterly results, the company faces challenges in long-term fundamentals and technical indicators, prompting a cautious stance from analysts.
Read full news article Announcements
Corporate Actions

27 Jul 2026

Kanpur Plastipack Ltd has declared 12% dividend, ex-date: 03 Aug 26

No Splits history available

Kanpur Plastipack Ltd has announced 1:2 bonus issue, ex-date: 15 Sep 21

Kanpur Plastipack Ltd has announced 1:5 rights issue, ex-date: 14 Dec 17
Quality key factors
Valuation key factors
Technicals key factors
 Technical Indicator Scale: Bearish, Mildly Bearish, Sideways, Mildly Bullish, Bullish Turned
 Shareholding Snapshot : Jun 2026
Shareholding Compare (%holding)
Promoters
None
Held by 0 Schemes
Held by 1 FIIs (0.02%)
Usha Agarwal (13.26%)
Jayatika Goyal (2.39%)
15.23%
Quarterly Results Snapshot (Consolidated) - Mar'26 - QoQ

QoQ Growth in quarter ended Mar 2026 is -6.53% vs 16.31% in Dec 2025

QoQ Growth in quarter ended Mar 2026 is 39.48% vs 38.94% in Dec 2025
Half Yearly Results Snapshot (Consolidated) - Sep'25
Growth in half year ended Sep 2025 is 21.45% vs 28.58% in Sep 2024
Growth in half year ended Sep 2025 is 4,651.72% vs -93.27% in Sep 2024
Nine Monthly Results Snapshot (Consolidated) - Dec'25
YoY Growth in nine months ended Dec 2025 is 20.73% vs 29.06% in Dec 2024
YoY Growth in nine months ended Dec 2025 is 202.34% vs 431.02% in Dec 2024
Annual Results Snapshot (Consolidated) - Mar'26
YoY Growth in year ended Mar 2026 is 27.36% vs 13.46% in Mar 2025
YoY Growth in year ended Mar 2026 is 255.54% vs 1,271.60% in Mar 2025
About Kanpur Plastipack Ltd

Company Coordinates


