
Compare Karnavati Financ with Similar Stocks
Dashboard
With HIgh Debt (Debt-Equity Ratio at 13.81 times)- the company has a Weak Long Term Fundamental Strength
- Low ability to service debt as the company has a high Debt to EBITDA ratio of -32.20 times
- The company has been able to generate a Return on Equity (avg) of 1.49% signifying low profitability per unit of shareholders funds
Negative results in Mar 26
Risky - Negative EBITDA
Consistent Underperformance against the benchmark over the last 3 years
Stock DNA
Non Banking Financial Company (NBFC)
INR 14 Cr (Micro Cap)
NA (Loss Making)
33
0.00%
13.81
-136.03%
3.30
Total Returns (Price + Dividend) 
Karnavati Financ for the last several years.
Risk Adjusted Returns v/s
Returns Beta

News
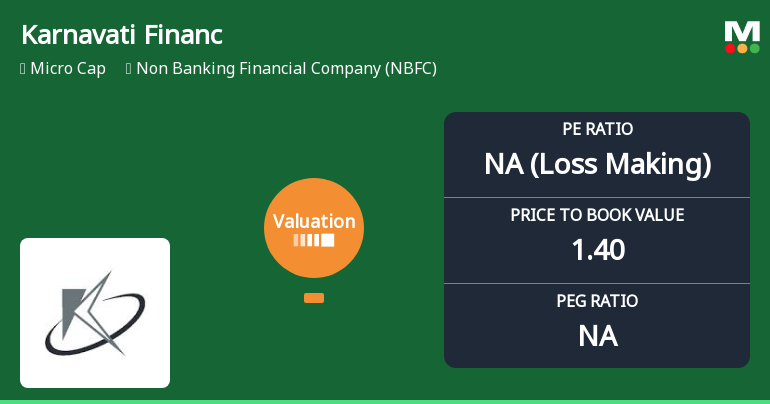
Karnavati Finance Ltd Valuation Shifts Signal Heightened Risk for Investors
Karnavati Finance Ltd, a micro-cap player in the Non Banking Financial Company (NBFC) sector, has seen a marked deterioration in its valuation parameters, prompting a downgrade in its investment grade to Strong Sell. The company’s price-to-earnings (P/E) ratio and price-to-book value (P/BV) metrics now signal heightened risk, reflecting both operational challenges and market sentiment shifts.
Read full news article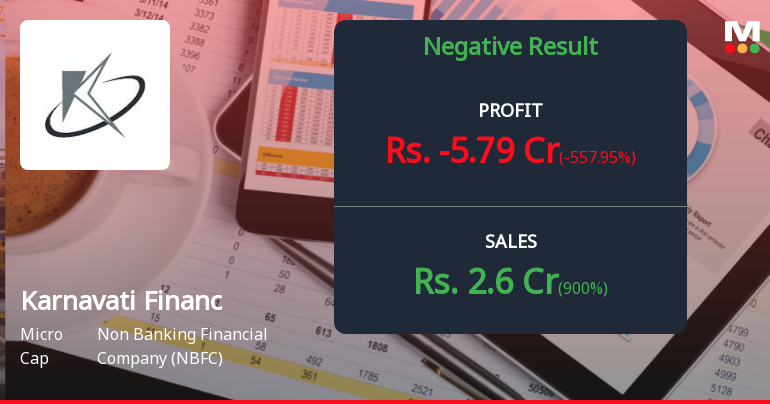
Karnavati Finance Q4 FY26: Mounting Losses Signal Deepening Crisis
Karnavati Finance Ltd., a Mumbai-based non-banking financial company, reported a staggering net loss of ₹5.79 crores in Q4 FY26, marking a dramatic deterioration from the modest profit of ₹0.70 crores recorded in the previous quarter. The company's performance represents a severe setback, with the quarterly loss widening by an alarming 927.14% on a sequential basis and plunging from a loss of ₹0.88 crores in the year-ago quarter.
Read full news article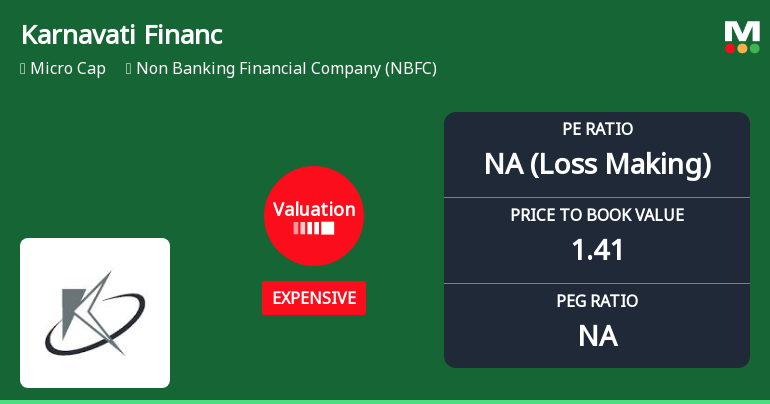
Karnavati Finance Ltd Valuation Shifts Signal Heightened Price Risk Amid Weak Returns
Karnavati Finance Ltd, a micro-cap player in the Non Banking Financial Company (NBFC) sector, has seen its valuation parameters shift notably over recent months, raising questions about its price attractiveness relative to peers and historical benchmarks. Despite a modest share price decline, the company’s price-to-earnings (P/E) and price-to-book value (P/BV) ratios reflect a transition from very expensive to merely expensive territory, signalling a nuanced change in investor sentiment amid ongoing operational challenges.
Read full news article Announcements
Compliances-Certificate under Reg. 74 (5) of SEBI (DP) Regulations 2018
11-Jul-2026 | Source : BSESubmission of Certificate under Regulation 74(5) of SEBI (DP) Regulations 2018
Closure of Trading Window
30-Jun-2026 | Source : BSEClosure of Trading window
Compliances-Reg.24(A)-Annual Secretarial Compliance
30-May-2026 | Source : BSESubmission of Annual Secretarial Compliance Report
Corporate Actions

No Upcoming Board Meetings

No Dividend history available

Karnavati Finance Ltd has announced 1:10 stock split, ex-date: 24 Feb 23

No Bonus history available

No Rights history available
Quality key factors
Valuation key factors
Technicals key factors
 Technical Indicator Scale: Bearish, Mildly Bearish, Sideways, Mildly Bullish, Bullish Turned
 Shareholding Snapshot : Jun 2026
Shareholding Compare (%holding)
Promoters
None
Held by 0 Schemes
Held by 0 FIIs
Raman P Morzaria (30.99%)
Theeta Trading Llp (3.73%)
29.8%
Quarterly Results Snapshot (Standalone) - Mar'26 - YoY

YoY Growth in quarter ended Mar 2026 is 900.00% vs -70.79% in Mar 2025

YoY Growth in quarter ended Mar 2026 is -557.95% vs -388.89% in Mar 2025
Half Yearly Results Snapshot (Standalone) - Sep'25
Growth in half year ended Sep 2025 is 575.56% vs -48.86% in Sep 2024
Growth in half year ended Sep 2025 is -538.36% vs -417.39% in Sep 2024
Nine Monthly Results Snapshot (Standalone) - Dec'25
YoY Growth in nine months ended Dec 2025 is 538.17% vs -39.07% in Dec 2024
YoY Growth in nine months ended Dec 2025 is -401.27% vs 46.98% in Dec 2024
Annual Results Snapshot (Standalone) - Mar'26
YoY Growth in year ended Mar 2026 is 238.22% vs -48.36% in Mar 2025
YoY Growth in year ended Mar 2026 is -251.19% vs -0.60% in Mar 2025
About Karnavati Finance Ltd

Company Coordinates


