
Compare Karnika Industri with Similar Stocks
Dashboard
Despite the size of the company, domestic mutual funds hold only 0% of the company
- Domestic mutual funds have capability to do in-depth on-the-ground research on companies- their small stake may signify either they are not comfortable at the price or the business
Below par performance in long term as well as near term
Stock DNA
Garments & Apparels
INR 780 Cr (Micro Cap)
24.00
26
0.08%
0.74
28.04%
8.20
Total Returns (Price + Dividend) 
Latest dividend: 0.1 per share ex-dividend date: Nov-20-2025
Risk Adjusted Returns v/s
Returns Beta

News

Karnika Industries Ltd is Rated Sell
Karnika Industries Ltd is rated Sell by MarketsMOJO, with this rating last updated on 19 June 2026. However, the analysis and financial metrics discussed here reflect the stock’s current position as of 12 July 2026, providing investors with the latest insights into the company’s performance and outlook.
Read full news article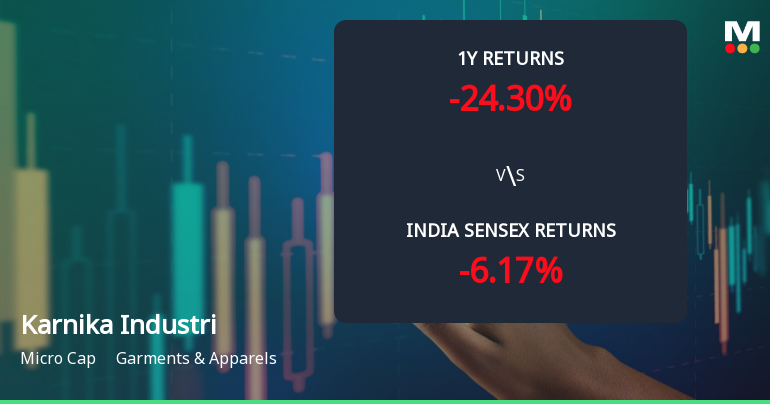
Karnika Industries Ltd Faces Intensified Downtrend Amid Technical Deterioration
Karnika Industries Ltd, a micro-cap player in the Garments & Apparels sector, has seen a marked deterioration in its technical outlook, with key momentum indicators signalling a shift from a mildly bearish stance to a more pronounced bearish trend. The stock’s recent price action, combined with weakening technical parameters, underscores mounting selling pressure and a challenging near-term outlook for investors.
Read full news article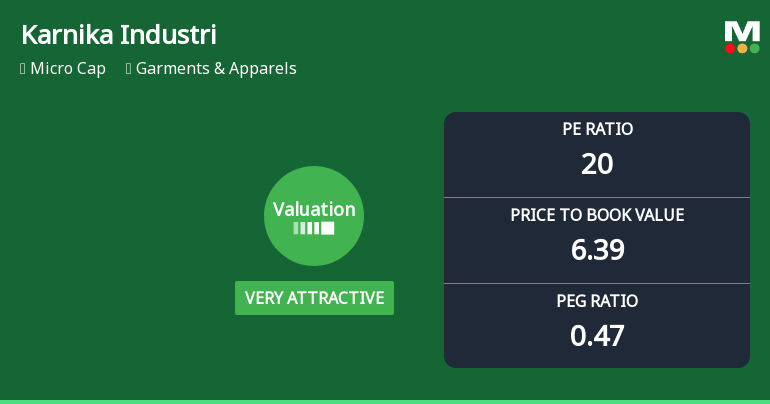
Karnika Industries Ltd Valuation Shifts Signal Renewed Price Attractiveness Amid Market Downturn
Karnika Industries Ltd, a micro-cap player in the Garments & Apparels sector, has seen a marked improvement in its valuation parameters, shifting from an attractive to a very attractive rating. Despite recent share price weakness, the company’s price-to-earnings (P/E) and price-to-book value (P/BV) ratios now present a compelling case for investors seeking value in a challenging market environment.
Read full news article Announcements
Corporate Actions

No Upcoming Board Meetings

Karnika Industries Ltd has declared 1% dividend, ex-date: 20 Nov 25

No Splits history available

Karnika Industries Ltd has announced 4:1 bonus issue, ex-date: 29 Aug 25

No Rights history available
Quality key factors
Valuation key factors
Technicals key factors
 Technical Indicator Scale: Bearish, Mildly Bearish, Sideways, Mildly Bullish, Bullish Turned
 Shareholding Snapshot : Mar 2026
Shareholding Compare (%holding)
Promoters
None
Held by 0 Schemes
Held by 0 FIIs
Niranjan Mundhra (24.46%)
None
13.34%
Quarterly Results Snapshot (Standalone) - Jun'26 - QoQ

QoQ Growth in quarter ended Jun 2026 is -1.76% vs 0.71% in Mar 2026
QoQ Growth in quarter ended Jun 2026 is -7.20% vs 25.91% in Mar 2026
Half Yearly Results Snapshot (Standalone) - Sep'25

Growth in half year ended Sep 2025 is 36.60% vs -22.37% in Mar 2025
Growth in half year ended Sep 2025 is 62.24% vs -25.80% in Mar 2025
Nine Monthly Results Snapshot (Standalone) - Dec'25
YoY Growth in nine months ended Dec 2025 is 45.69% vs -9.62% in Dec 2024
YoY Growth in nine months ended Dec 2025 is 59.44% vs -0.84% in Dec 2024
Annual Results Snapshot (Standalone) - Mar'26
YoY Growth in year ended Mar 2026 is 29.98% vs 35.58% in Mar 2025
YoY Growth in year ended Mar 2026 is 47.98% vs 78.51% in Mar 2025
About Karnika Industries Ltd

Company Coordinates


