Kaya Ltd

  • Market Cap: Micro Cap
  • Industry: Leisure Services
  • ISIN: INE587G01015
  • NSEID: KAYA
  • BSEID: 539276
INR
345.10
16.4 (4.99%)
BSENSE

Sep 04, 11:31 AM

BSE+NSE Vol: 9.82 k

  • Price Points
  • Score
  • Mojo Parameters
  • Total Return
  • News and Corporate Actions
  • Key factors
  • Shareholding
  • Financials
  • CompanyCV
stock-summaryPrice Point
High/Low

1Day

52 Week

Valuation
Technical
Day's Volume

CASH

9.82 k (256.49%) Volume

Shareholding (Jun 2026)

FII

0.71%

Held by 8 FIIs

DII

2.99%

Held by 0 DIIs

Promoter

51.43%

Why is Kaya Ltd falling/rising?

04-Sep-2026

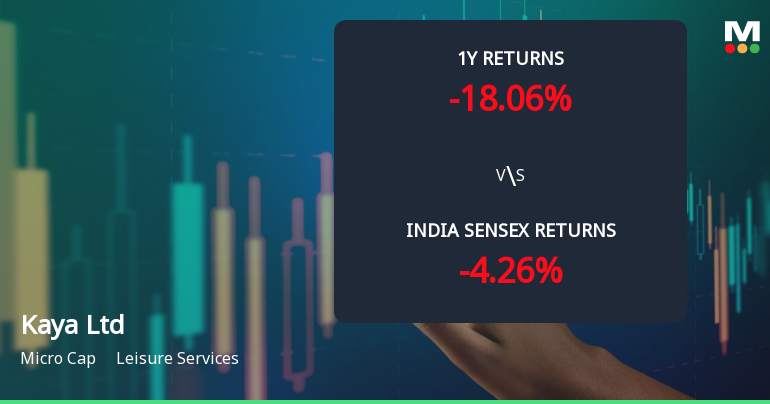
As of 03-Sep, Kaya Ltd's stock price is at 326.75, down 1.5 points or 0.46%. The stock has underperformed significantly, with a year-to-date decline of 17.35% and a 20.03% drop over the past year, despite a recent monthly gain of 18.32%.

As of 03-Sep, Kaya Ltd's stock price is falling, currently at 326.75, reflecting a decrease of 1.5 points or 0.46%. The stock has been underperforming, having lost 2.61% over the last three days, and it has consistently declined for three consecutive days. In comparison to the broader market, represented by the Sensex, Kaya Ltd's performance has also been disappointing, with a year-to-date decline of 17.35% compared to the Sensex's 10.64%. <BR><BR>In the past week, the stock has decreased by 3.31%, while the Sensex has only fallen by 1.01%. Despite a positive performance over the past month, where the stock gained 18.32%, the overall trend indicates a significant downturn over longer periods, including a 20.03% drop over the past year and a 29.44% decline over the past five years. <BR><BR>Additionally, while there has been a rise in investor participation, with delivery volume increasing by 11.2% against the five-day average, the stock's current performance still reflects a lack of momentum, as it is underperforming its sector by 1.38%. Overall, these factors contribute to the stock's current downward trajectory.

View full answer

Who are in the management team of Kaya Ltd?

01-Sep-2026

The management team of Kaya Ltd includes Harsh Mariwala (Chairman & Managing Director), Rajendra Mariwala, Rishabh Mariwala, and Nitika Dalmia (Company Secretary). The board also features independent directors Nikhil Khattau, B S Nagesh, Irfan Mustafa, Om Prakash Manchanda, and Vasuta Agarwal.

The management team of Kaya Ltd includes the following individuals:<BR><BR>1. **Harsh Mariwala** - Chairman & Managing Director<BR>2. **Rajendra Mariwala** - Director<BR>3. **Rishabh Mariwala** - Director<BR>4. **Nitika Dalmia** - Company Secretary & Compliance Officer<BR><BR>Additionally, the board features several independent directors:<BR><BR>1. **Nikhil Khattau** - Independent Director<BR>2. **B S Nagesh** - Independent Director<BR>3. **Irfan Mustafa** - Independent Director<BR>4. **Om Prakash Manchanda** - Independent Director<BR>5. **Vasuta Agarwal** - Independent Director<BR><BR>This team brings a diverse range of expertise and leadership to the company.

View full answer

What does Kaya Ltd do?

01-Sep-2026

Kaya Ltd is a micro-cap company in the leisure services industry, specializing in skin care in India and the Middle East. As of June 2026, it reported net sales of 60 Cr and a net loss of 15 Cr.

Overview:<BR>Kaya Ltd operates in the leisure services industry, focusing on skin care business in India and the Middle East, and is categorized as a micro-cap company.<BR><BR>History:<BR>Kaya Ltd was incorporated as Kaya Skin Care Ltd on March 27, 2003, and changed its name to Kaya Limited in March 2012. The latest quarterly results reported net sales and profit for the period ending June 2026.<BR><BR>Financial Snapshot:<BR>Net Sales: 60 Cr (Quarterly Results - Jun 2026) <BR>Net Profit: -15 Cr (Quarterly Results - Jun 2026) <BR>Market Cap: INR 516 Cr (Micro Cap)<BR><BR>Key Metrics:<BR>P/E: N/A <BR>Industry P/E: 45 <BR>Dividend Yield: 0.00% <BR>Debt-Equity: -1.67 <BR>Return on Equity: 62.01% <BR>Price to Book: -3.22<BR><BR>Contact Details:<BR>Address: 23/C Mahal Industrial Area, Mahakali Caves Road Bandra (W) Mumbai Maharashtra : 400093 <BR>Tel: 91-22-66195000 <BR>Email: investorrelations@kayaindia.net <BR>Website: http://www.kaya.in

View full answer

Who are the peers of the Kaya Ltd?

01-Sep-2026

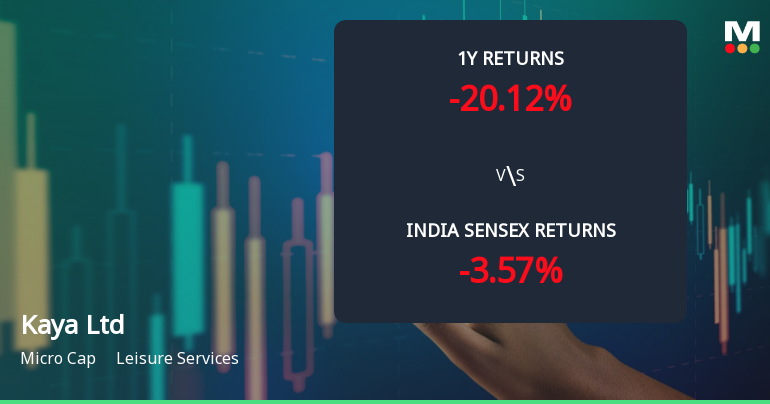
Kaya Ltd's peers include Imagica Enter., United Foodbrand, Delta Corp, Speciality Rest., Coffee Day Enter, Nicco Parks, Gourmet Gateway, Vikram Kamats, and Pecos Hotels. Notably, United Foodbrand has the highest 1-year return at 171.12%, while Kaya Ltd's return is -20.12%.

Peers: The peers of Kaya Ltd are Imagica. Enter., United Foodbrand, Delta Corp, Speciality Rest., Coffee Day Enter, Nicco Parks, Gourmet Gateway, Vikram Kamats, and Pecos Hotels.<BR><BR>Quality Snapshot: Excellent management risk is observed at Nicco Parks and Pecos Hotels, while Average management risk is found at Delta Corp, Speciality Rest., and Vikram Kamats, and the rest have Below Average management risk. Growth is Excellent at Nicco Parks, Average at Delta Corp and Speciality Rest., and Below Average at Imagica. Enter., United Foodbrand, Coffee Day Enter, Kaya Ltd, Gourmet Gateway, and Vikram Kamats. Capital Structure is Excellent at Nicco Parks and Gourmet Gateway, Good at Speciality Rest. and Pecos Hotels, Average at Delta Corp and Imagica. Enter., and Below Average at United Foodbrand, Coffee Day Enter, Kaya Ltd, and Vikram Kamats.<BR><BR>Return Snapshot: The peer with the highest 1-year return is United Foodbrand at 171.12%, while the peer with the lowest is Coffee Day Enter at -40.92%. Kaya Ltd's 1-year return is -20.12%, which is better than Coffee Day Enter but worse than United Foodbrand. Additionally, Delta Corp, Coffee Day Enter, and Vikram Kamats have negative six-month returns.

View full answer

How big is Kaya Ltd?

01-Sep-2026

As of 31st August, Kaya Ltd has a market capitalization of 516.00 Cr and reported net sales of 222.48 Cr with a loss of 96.18 Cr over the latest four quarters. As of March 2026, shareholder's funds were at a loss of 152.76 Cr, with total assets valued at 277.91 Cr.

As of 31st August, Kaya Ltd has a market capitalization of 516.00 Cr, categorizing it as a Micro Cap company.<BR><BR>In the latest four quarters, Kaya Ltd reported net sales of 222.48 Cr. However, the company experienced a loss of 96.18 Cr during the same period.<BR><BR>The latest annual period for the balance sheet is March 2026, where shareholder's funds stood at a loss of 152.76 Cr, while total assets were valued at 277.91 Cr.

View full answer

Should I buy, sell or hold Kaya Ltd?

04-Aug-2026

When is the next results date for Kaya Ltd?

30-Jul-2026

The next results date for Kaya Ltd is 03 August 2026.

The next results date for Kaya Ltd is scheduled for 03 August 2026.

View full answer

Are Kaya Ltd latest results good or bad?

21-May-2026

Kaya Ltd's latest results are concerning, showing a net loss of ₹27.77 crores in Q4 FY26, a 295.58% decline year-on-year, with negative operating margins and a negative book value of ₹-106.47 per share, indicating significant financial distress. Investors should be cautious, as the outlook remains bleak without substantial operational improvements.

Kaya Ltd's latest results are concerning and reflect a significant decline in financial health. In the fourth quarter of FY26, the company reported a net loss of ₹27.77 crores, which is a drastic deterioration of 295.58% year-on-year. This marks a continuing trend of operational distress, as the operating margin (excluding other income) fell to -22.72%, the worst performance in eight quarters.<BR><BR>Despite a slight year-on-year growth in net sales of 2.03%, the sequential decline of 7.06% indicates that the company is struggling to maintain revenue momentum. The negative book value of ₹-106.47 per share further compounds concerns about its financial stability, as it suggests that liabilities exceed assets.<BR><BR>Overall, Kaya Ltd's financial metrics indicate a company in distress, with persistent losses, negative operating margins, and a high debt burden. Investors should approach this stock with caution, as the outlook appears bleak without significant operational improvements.

View full answer

How has been the historical performance of Kaya Ltd?

13-Nov-2025

Kaya Ltd has experienced significant fluctuations in financial performance, with net sales declining from 420.87 Cr in Mar'19 to 217.17 Cr in Mar'25, though recent years show signs of recovery, including a net profit improvement from -129.65 Cr in Mar'24 to 83.68 Cr in Mar'25. The company continues to face challenges, including low cash flow and negative profit before tax.

Answer:<BR>The historical performance of Kaya Ltd shows significant fluctuations in its financial metrics over the years, particularly in net sales, operating profit, and net profit.<BR><BR>Breakdown:<BR>Kaya Ltd's net sales have seen a decline from 420.87 Cr in Mar'19 to 217.17 Cr in Mar'25, with a notable drop in Mar'23 to 376.73 Cr and a slight recovery in Mar'24 to 205.18 Cr. The total operating income followed a similar trend, peaking at 420.87 Cr in Mar'19 and falling to 217.17 Cr in Mar'25. The company faced increasing raw material costs, which rose from 16.19 Cr in Mar'19 to 11.78 Cr in Mar'25, while employee costs peaked at 173.54 Cr in Mar'23 before decreasing to 60.76 Cr in Mar'25. Operating profit (PBDIT) was negative in several years, with a significant loss of -32.59 Cr in Mar'24, but improved to 34.93 Cr in Mar'25. Despite this, the profit before tax remained negative throughout, with the worst performance recorded at -116.26 Cr in Mar'23, improving to -33.37 Cr in Mar'25. The consolidated net profit also showed a recovery from -129.65 Cr in Mar'24 to 83.68 Cr in Mar'25. On the balance sheet, total liabilities decreased from 408.81 Cr in Mar'20 to 236.74 Cr in Mar'25, while total assets also declined from 369.96 Cr in Mar'23 to 236.74 Cr in Mar'25. Cash flow from operating activities remained low, with a net cash outflow of -10.00 Cr in Mar'25, indicating ongoing challenges in generating cash. Overall, Kaya Ltd's financial performance reflects a volatile history with recent signs of recovery.

View full answer

Is Kaya Ltd technically bullish or bearish?

30-Oct-2025

As of 29 October 2025, Kaya Ltd's technical trend is mildly bullish, supported by daily moving averages and monthly MACD, despite some short-term caution from weekly indicators and recent underperformance compared to the Sensex.

As of 29 October 2025, the technical trend for Kaya Ltd has changed from sideways to mildly bullish. The daily moving averages indicate a mildly bullish stance, while the monthly MACD supports a bullish outlook. However, the weekly MACD and KST are mildly bearish, suggesting some caution in the short term. The Bollinger Bands show a mildly bullish trend on the monthly chart, which aligns with the overall bullish sentiment. Despite recent underperformance compared to the Sensex over the past month and week, the longer-term returns remain positive. Overall, the current technical stance is mildly bullish, driven primarily by the daily moving averages and monthly MACD.

View full answer

Who are the top shareholders of the Kaya Ltd?

17-Jul-2025

The top shareholders of Kaya Ltd include Harsh C Mariwala and the Late Kishore V Mariwala for the Valentine Family Trust, holding 10.87%, and Ganesh Srinivasan as the highest public shareholder with 3.04%. Individual investors own 28.3% of shares, while 8 foreign institutional investors hold 1.5%, with no pledged promoter holdings or mutual fund investments.

The top shareholders of Kaya Ltd include the promoters, with Harsh C Mariwala, along with the Late Kishore V Mariwala for the Valentine Family Trust, holding the largest stake at 10.87%. Additionally, Ganesh Srinivasan is the highest public shareholder with a holding of 3.04%. The company also has individual investors holding 28.3% of the shares, while 8 foreign institutional investors (FIIs) collectively hold 1.5%. There are no pledged promoter holdings, and mutual funds do not currently hold any shares in the company.

View full answer

Has Kaya Ltd declared dividend?

06-Jun-2025

No Dividend History Available

iScoreScore
Click here to find our call on this stock
Strong Sell
Sell
Hold
Buy
Strong Buy

Dashboard

1

With a Negative Book Value, the company has a Weak Long Term Fundamental Strength

  • Poor long term growth as Net Sales has grown by an annual rate of 11.94% over the last 5 years
  • Company's ability to service its debt is weak with a poor EBIT to Interest (avg) ratio of -6.21
2

Flat results in Jun 26

3

Risky - Negative EBITDA

4

Despite the size of the company, domestic mutual funds hold only 0% of the company

5

Consistent Underperformance against the benchmark over the last 3 years

stock-summaryMojo Parameters

Mojo Parameters

Loading Valuation Snapshot...

Stock DNA

stock-summary
Industry

Leisure Services

stock-summary
Market cap

INR 524 Cr (Micro Cap)

stock-summary
P/E

NA (Loss Making)

stock-summary
Industry P/E

44

stock-summary
Dividend Yield

0.00%

stock-summary
Debt Equity

-1.67

stock-summary
Return on Equity

62.01%

stock-summary
Price to Book

-3.25

Revenue and Profits:
Net Sales:
60 Cr
(Quarterly Results - Jun 2026)
Net Profit:
-15 Cr
stock-summaryTotal Returns
Total Returns (Price + Dividend) stock-summary
Dividend Yield (0%)
TimePeriod
Price Return
Dividend Return
Total Return
3 Months
37.3%
0%
37.3%
6 Months
10.04%
0%
10.04%
1 Year
-16.48%
0%
-16.48%
2 Years
-30.24%
0%
-30.24%
3 Years
-5.75%
0%
-5.75%
4 Years
4.12%
0%
4.12%
5 Years
-25.31%
0%
-25.31%

Kaya Ltd for the last several years.

Risk Adjusted Returns v/s stock-summary
Returns Beta
Icon
Beta has not been calculated since enough price history is not available
stock-summaryNews & Corporate Actions

Announcements stock-summary

Kaya Limited - Analysts/Institutional Investor Meet/Con. Call Updates

03-Dec-2019 | Source : NSE

Kaya Limited has informed the Exchange regarding Analysts/Institutional Investor Meet/Con. Call Updates

Kaya Limited - Investor Presentation

25-Oct-2019 | Source : NSE

Kaya Limited has informed the Exchange regarding Investor Presentation

Kaya Limited - Analysts/Institutional Investor Meet/Con. Call Updates

22-Oct-2019 | Source : NSE

Kaya Limited has informed the Exchange regarding Analysts/Institutional Investor Meet/Con. Call Updates

Corporate Actions stock-summary

stock-summary
BOARD MEETING

No Upcoming Board Meetings

stock-summary
DIVIDEND

No Dividend history available

stock-summary
SPLITS

No Splits history available

stock-summary
BONUS

No Bonus history available

stock-summary
RIGHTS

No Rights history available

stock-summaryKey Factors

Quality key factors stock-summary

Factor
Value
Sales Growth (5y)
11.94%
EBIT Growth (5y)
-250.39%
EBIT to Interest (avg)
-6.21
Debt to EBITDA (avg)
5.85
Net Debt to Equity (avg)
-1.67
Sales to Capital Employed (avg)
1.33
Tax Ratio
0
Dividend Payout Ratio
0
Pledged Shares
0
Institutional Holding
3.69%
ROCE (avg)
-54.41%
ROE (avg)
0

Valuation key factors

Factor
Value
P/E Ratio
NA (Loss Making)
Industry P/E
24
Price to Book Value
-3.25
EV to EBIT
-11.09
EV to EBITDA
-31.61
EV to Capital Employed
7.33
EV to Sales
3.38
PEG Ratio
NA
Dividend Yield
NA
ROCE (Latest)
-66.08%
ROE (Latest)
Negative BV

Technicals key factors

Indicator
Weekly
Monthly
MACD
Bullish
Bearish
RSI
No Signal
No Signal
Bollinger Bands
Bullish
Bearish
Moving Averages
Mildly Bearish (Daily)
KST
Bullish
Bearish
Dow Theory
Mildly Bullish
No Trend
OBV
No Trend
No Trend
stock-summary Technical Indicator Scale: Bearish, Mildly Bearish, Sideways, Mildly Bullish, Bullish  Turned 
stock-summaryShareholding
Shareholding Snapshot : Jun 2026stock-summary
Shareholding Compare (%holding) stock-summary
Majority shareholders

Promoters

Pledged Promoter Holdings

None

Mutual Funds

Held by 0 Schemes

FIIs

Held by 8 FIIs (0.71%)

Promoter with highest holding

Harsh C Mariwala With Late Kishore V Mariwala For Valentine Family Trust (9.37%)

Highest Public shareholder

Axana Estates Llp (13.76%)

Individual Investors Holdings

23.24%

stock-summaryFinancial
[
  {
    "link": "quarterly",
    "btn_text": "All Quarterly Results",
    "header": "Quarterly Results Snapshot (Standalone) - Jun'26 - YoY",
    "rhs": [
      {
        "prefix": "Net Sales ",
        "suffix": "YoY Growth in quarter ended Jun 2026 is 13.92% vs 1.46% in Jun 2025",
        "dir": 1
      },
      {
        "prefix": "Standalone Net Profit ",
        "suffix": "YoY Growth in quarter ended Jun 2026 is -7.89% vs -316.80% in Jun 2025",
        "dir": 1
      }
    ],
    "table": {
      "header": [
        "Jun'26",
        "Jun'25",
        "Change(%)"
      ],
      "body": [
        {
          "field": "Net Sales",
          "val1": "60.14",
          "val2": "52.79",
          "chgp": "13.92%",
          "chgp_class": "positive"
        },
        {
          "field": "Operating Profit (PBDIT) excl Other Income",
          "val1": "3.86",
          "val2": "3.73",
          "chgp": "3.49%",
          "chgp_class": "positive"
        },
        {
          "field": "Interest",
          "val1": "9.34",
          "val2": "8.49",
          "chgp": "10.01%",
          "chgp_class": "negative"
        },
        {
          "field": "Exceptional Items",
          "val1": "0.00",
          "val2": "0.00",
          "chgp": "",
          "chgp_class": "neutral"
        },
        {
          "field": "Standalone Net Profit",
          "val1": "-15.18",
          "val2": "-14.07",
          "chgp": "-7.89%",
          "chgp_class": "negative"
        },
        {
          "field": "Operating Profit Margin (Excl OI)",
          "val1": "6.42%",
          "val2": "7.07%",
          "chgp": "-0.65%",
          "chgp_class": "negative"
        }
      ]
    }
  },
  {
    "link": "half-yearly",
    "btn_text": "All Half Yearly Results",
    "header": "Half Yearly Results Snapshot (Consolidated) - Sep'25",
    "rhs": [
      {
        "prefix": "Net Sales ",
        "suffix": " Growth in half year ended Sep 2025 is 2.18% vs -49.42% in Sep 2024",
        "dir": 1
      },
      {
        "prefix": "Consolidated Net Profit ",
        "suffix": " Growth in half year ended Sep 2025 is -137.75% vs 500.28% in Sep 2024",
        "dir": -1
      }
    ],
    "table": {
      "header": [
        "Sep'25",
        "Sep'24",
        "Change(%)"
      ],
      "body": [
        {
          "field": "Net Sales",
          "val1": "106.64",
          "val2": "104.36",
          "chgp": "2.18%",
          "chgp_class": "positive"
        },
        {
          "field": "Operating Profit (PBDIT) excl Other Income",
          "val1": "0.35",
          "val2": "11.41",
          "chgp": "-96.93%",
          "chgp_class": "negative"
        },
        {
          "field": "Interest",
          "val1": "17.40",
          "val2": "15.03",
          "chgp": "15.77%",
          "chgp_class": "negative"
        },
        {
          "field": "Exceptional Items",
          "val1": "0.00",
          "val2": "97.85",
          "chgp": "-100.00%",
          "chgp_class": "negative"
        },
        {
          "field": "Consolidate Net Profit",
          "val1": "-32.85",
          "val2": "87.02",
          "chgp": "-137.75%",
          "chgp_class": "negative"
        },
        {
          "field": "Operating Profit Margin (Excl OI)",
          "val1": "0.33%",
          "val2": "10.93%",
          "chgp": "-10.60%",
          "chgp_class": "negative"
        }
      ]
    }
  },
  {
    "link": "nine-monthly",
    "btn_text": "All Nine Monthly Results",
    "header": "Nine Monthly Results Snapshot (Consolidated) - Dec'25",
    "rhs": [
      {
        "prefix": "Net Sales ",
        "suffix": "YoY Growth in nine months ended Dec 2025 is 2.58% vs -47.37% in Dec 2024",
        "dir": 1
      },
      {
        "prefix": "Consolidated Net Profit ",
        "suffix": "YoY Growth in nine months ended Dec 2025 is -175.42% vs 402.13% in Dec 2024",
        "dir": -1
      }
    ],
    "table": {
      "header": [
        "Dec'25",
        "Dec'24",
        "Change(%)"
      ],
      "body": [
        {
          "field": "Net Sales",
          "val1": "166.68",
          "val2": "162.48",
          "chgp": "2.58%",
          "chgp_class": "positive"
        },
        {
          "field": "Operating Profit (PBDIT) excl Other Income",
          "val1": "-11.10",
          "val2": "16.17",
          "chgp": "-168.65%",
          "chgp_class": "negative"
        },
        {
          "field": "Interest",
          "val1": "26.42",
          "val2": "22.79",
          "chgp": "15.93%",
          "chgp_class": "negative"
        },
        {
          "field": "Exceptional Items",
          "val1": "-5.19",
          "val2": "112.91",
          "chgp": "-104.60%",
          "chgp_class": "negative"
        },
        {
          "field": "Consolidate Net Profit",
          "val1": "-68.41",
          "val2": "90.70",
          "chgp": "-175.42%",
          "chgp_class": "negative"
        },
        {
          "field": "Operating Profit Margin (Excl OI)",
          "val1": "-6.66%",
          "val2": "9.95%",
          "chgp": "-16.61%",
          "chgp_class": "negative"
        }
      ]
    }
  },
  {
    "link": "annual",
    "btn_text": "All Annual Results",
    "header": "Annual Results Snapshot (Consolidated) - Mar'26",
    "rhs": [
      {
        "prefix": "Net Sales ",
        "suffix": "YoY Growth in year ended Mar 2026 is 2.45% vs 5.84% in Mar 2025",
        "dir": -1
      },
      {
        "prefix": "Consolidated Net Profit ",
        "suffix": "YoY Growth in year ended Mar 2026 is -214.93% vs 164.54% in Mar 2025",
        "dir": -1
      }
    ],
    "table": {
      "header": [
        "Mar'26",
        "Mar'25",
        "Change(%)"
      ],
      "body": [
        {
          "field": "Net Sales",
          "val1": "222.48",
          "val2": "217.17",
          "chgp": "2.45%",
          "chgp_class": "positive"
        },
        {
          "field": "Operating Profit (PBDIT) excl Other Income",
          "val1": "-23.78",
          "val2": "17.88",
          "chgp": "-233.00%",
          "chgp_class": "negative"
        },
        {
          "field": "Interest",
          "val1": "35.62",
          "val2": "30.66",
          "chgp": "16.18%",
          "chgp_class": "negative"
        },
        {
          "field": "Exceptional Items",
          "val1": "-1.45",
          "val2": "117.04",
          "chgp": "-101.24%",
          "chgp_class": "negative"
        },
        {
          "field": "Consolidate Net Profit",
          "val1": "-96.17",
          "val2": "83.68",
          "chgp": "-214.93%",
          "chgp_class": "negative"
        },
        {
          "field": "Operating Profit Margin (Excl OI)",
          "val1": "-10.69%",
          "val2": "8.23%",
          "chgp": "-18.92%",
          "chgp_class": "negative"
        }
      ]
    }
  }
]

Quarterly Results Snapshot (Standalone) - Jun'26 - YoYstock-summary

Jun'26
Jun'25
Change(%)
Net Sales
60.14
52.79
13.92%
Operating Profit (PBDIT) excl Other Income
3.86
3.73
3.49%
Interest
9.34
8.49
10.01%
Exceptional Items
0.00
0.00
Standalone Net Profit
-15.18
-14.07
-7.89%
Operating Profit Margin (Excl OI)
6.42%
7.07%
-0.65%
Values in Rs Cr.
Direction Arrows
Net Sales

YoY Growth in quarter ended Jun 2026 is 13.92% vs 1.46% in Jun 2025

Direction Arrows
Standalone Net Profit

YoY Growth in quarter ended Jun 2026 is -7.89% vs -316.80% in Jun 2025

Half Yearly Results Snapshot (Consolidated) - Sep'25stock-summary

Sep'25
Sep'24
Change(%)
Net Sales
106.64
104.36
2.18%
Operating Profit (PBDIT) excl Other Income
0.35
11.41
-96.93%
Interest
17.40
15.03
15.77%
Exceptional Items
0.00
97.85
-100.00%
Consolidate Net Profit
-32.85
87.02
-137.75%
Operating Profit Margin (Excl OI)
0.33%
10.93%
-10.60%
Values in Rs Cr.
Direction Arrows
Net Sales

Growth in half year ended Sep 2025 is 2.18% vs -49.42% in Sep 2024

Direction Arrows
Consolidated Net Profit

Growth in half year ended Sep 2025 is -137.75% vs 500.28% in Sep 2024

Nine Monthly Results Snapshot (Consolidated) - Dec'25stock-summary

Dec'25
Dec'24
Change(%)
Net Sales
166.68
162.48
2.58%
Operating Profit (PBDIT) excl Other Income
-11.10
16.17
-168.65%
Interest
26.42
22.79
15.93%
Exceptional Items
-5.19
112.91
-104.60%
Consolidate Net Profit
-68.41
90.70
-175.42%
Operating Profit Margin (Excl OI)
-6.66%
9.95%
-16.61%
Values in Rs Cr.
Direction Arrows
Net Sales

YoY Growth in nine months ended Dec 2025 is 2.58% vs -47.37% in Dec 2024

Direction Arrows
Consolidated Net Profit

YoY Growth in nine months ended Dec 2025 is -175.42% vs 402.13% in Dec 2024

Annual Results Snapshot (Consolidated) - Mar'26stock-summary

Mar'26
Mar'25
Change(%)
Net Sales
222.48
217.17
2.45%
Operating Profit (PBDIT) excl Other Income
-23.78
17.88
-233.00%
Interest
35.62
30.66
16.18%
Exceptional Items
-1.45
117.04
-101.24%
Consolidate Net Profit
-96.17
83.68
-214.93%
Operating Profit Margin (Excl OI)
-10.69%
8.23%
-18.92%
Values in Rs Cr.
Direction Arrows
Net Sales

YoY Growth in year ended Mar 2026 is 2.45% vs 5.84% in Mar 2025

Direction Arrows
Consolidated Net Profit

YoY Growth in year ended Mar 2026 is -214.93% vs 164.54% in Mar 2025

stock-summaryCompany CV
About Kaya Ltd stock-summary
stock-summary
Kaya Ltd
Micro Cap
Leisure Services
Kaya Limited was formerly incorporated as Kaya Skin Care Ltd on March 27, 2003. The Company name was changed from Kaya Skin Care Limited to Kaya Limited in March, 2012. The Company, headquartered in Mumbai, carries on Skin Care Business in India and through its subsidiary in Middle East region. Up to March 31, 2013, the Kaya Business was conducted as subsidiaries of Marico Limited.
Company Coordinates stock-summary
Company Details
23/C Mahal Industrial Area, Mahakali Caves Road Bandra (W) Mumbai Maharashtra : 400093
stock-summary
Tel: 91-22-66195000
stock-summary
investorrelations@kayaindia.net
Registrar Details
Link Intime India Pvt Ltd, C-13 Pannalal Silk Compound, L B S Marg, Bhandup , Mumbai