
Compare Kaycee Inds. with Similar Stocks
Stock DNA
Other Electrical Equipment
INR 257 Cr (Micro Cap)
61.00
57
0.25%
0.00
13.21%
7.73
Total Returns (Price + Dividend) 
Latest dividend: 2 per share ex-dividend date: Aug-01-2025
Risk Adjusted Returns v/s
Returns Beta

News

Kaycee Industries Ltd is Rated Sell
Kaycee Industries Ltd is rated 'Sell' by MarketsMOJO, with this rating last updated on 05 May 2025. However, the analysis and financial metrics discussed here reflect the stock's current position as of 27 May 2026, providing investors with an up-to-date view of the company’s performance and outlook.
Read full news articleAre Kaycee Industries Ltd latest results good or bad?
Kaycee Industries Ltd's latest financial results for Q4 FY26 present a complex picture characterized by significant revenue growth juxtaposed with pronounced profitability challenges. The company reported consolidated net sales of ₹16.80 crores, reflecting a year-on-year increase of 9.23% and a sequential growth of 16.26%. This marks the highest quarterly revenue in its recent history, indicating some operational strength in generating sales. However, this top-line growth is overshadowed by a dramatic decline in profitability. The consolidated net profit fell to ₹0.71 crores, representing a 60.56% year-on-year decrease and a 34.86% drop from the previous quarter. This stark contrast between revenue growth and profit decline suggests underlying operational inefficiencies or rising costs that have not been effectively managed. The operating margin (excluding other income) decreased significantly to 9.11%, d...
Read full news article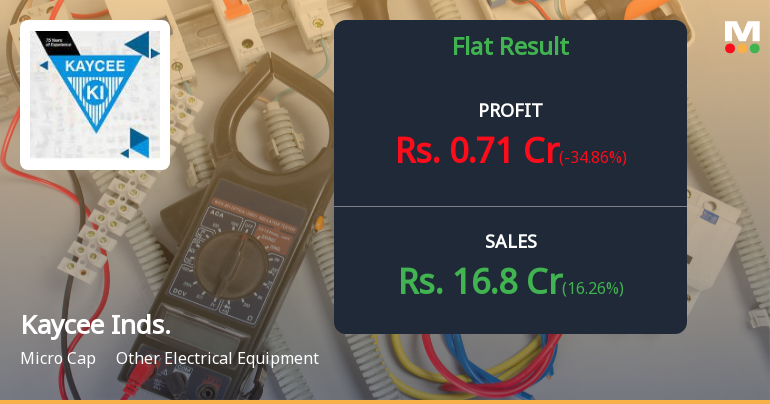
Kaycee Industries Q4 FY26: Margin Compression Weighs on Profitability Despite Revenue Growth
Kaycee Industries Limited, the Mumbai-based electrical equipment manufacturer, reported a challenging Q4 FY26 performance, with consolidated net profit plunging 60.56% year-on-year to ₹0.71 crores despite achieving its highest-ever quarterly revenue. The micro-cap company, which specialises in rotary switches, micro switches, and water meters, saw its operating margins compress sharply to 9.11% from 17.23% in the year-ago quarter, raising concerns about cost management and pricing power in an increasingly competitive market.
Read full news article Announcements
Compliances-Reg.24(A)-Annual Secretarial Compliance
27-May-2026 | Source : BSESecretarial Compliance report for the FY 2025-26
Announcement under Regulation 30 (LODR)-Newspaper Publication
20-May-2026 | Source : BSENewspaper publication on Financials and special window for share transfer request.
Results For FY 2025-26
19-May-2026 | Source : BSEResults for FY 2025-26
Corporate Actions

No Upcoming Board Meetings

Kaycee Industries Ltd has declared 20% dividend, ex-date: 31 Jul 26

Kaycee Industries Ltd has announced 10:100 stock split, ex-date: 05 Jul 24

Kaycee Industries Ltd has announced 4:1 bonus issue, ex-date: 05 Jul 24

Kaycee Industries Ltd has announced 1:1 rights issue, ex-date: 28 Mar 06
Quality key factors
Valuation key factors
Technicals key factors
 Technical Indicator Scale: Bearish, Mildly Bearish, Sideways, Mildly Bullish, Bullish Turned
 Shareholding Snapshot : Mar 2026
Shareholding Compare (%holding)
Promoters
None
Held by 0 Schemes
Held by 0 FIIs
Salzer Electronics Ltd (71.7%)
Anmol Sekhri Consultants Private Limited (1.26%)
18.32%
Quarterly Results Snapshot (Consolidated) - Mar'26 - QoQ

QoQ Growth in quarter ended Mar 2026 is 16.26% vs -3.09% in Dec 2025

QoQ Growth in quarter ended Mar 2026 is -34.86% vs -18.66% in Dec 2025
Half Yearly Results Snapshot (Standalone) - Sep'25
Growth in half year ended Sep 2025 is 10.98% vs 12.43% in Sep 2024
Growth in half year ended Sep 2025 is -4.61% vs 62.57% in Sep 2024
Nine Monthly Results Snapshot (Standalone) - Dec'25
YoY Growth in nine months ended Dec 2025 is 14.35% vs 7.05% in Dec 2024
YoY Growth in nine months ended Dec 2025 is 2.99% vs 37.33% in Dec 2024
Annual Results Snapshot (Consolidated) - Mar'26
YoY Growth in year ended Mar 2026 is 12.88% vs 8.99% in Mar 2025
YoY Growth in year ended Mar 2026 is -23.74% vs 28.51% in Mar 2025
About Kaycee Industries Ltd

Company Coordinates


