
Compare Keerthi Indus with Similar Stocks
Dashboard
With a Operating Losses, the company has a Weak Long Term Fundamental Strength
- Low ability to service debt as the company has a high Debt to EBITDA ratio of -2.23 times
- The company has been able to generate a Return on Equity (avg) of 3.48% signifying low profitability per unit of shareholders funds
The company has declared Negative results for the last 3 consecutive quarters
Risky - Negative EBITDA
44.65% of Promoter Shares are Pledged
Consistent Underperformance against the benchmark over the last 3 years
Stock DNA
Cement & Cement Products
INR 30 Cr (Micro Cap)
NA (Loss Making)
34
0.00%
0.87
-89.64%
1.19
Total Returns (Price + Dividend) 
Latest dividend: 1.5 per share ex-dividend date: Sep-15-2022
Risk Adjusted Returns v/s
Returns Beta

News
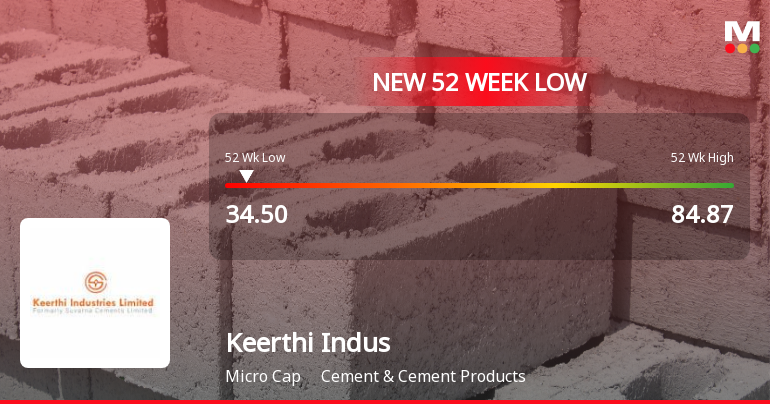
Keerthi Industries Ltd Falls to 52-Week Low of Rs 34.5 as Sell-Off Deepens
A sharp decline has pushed Keerthi Industries Ltd to a fresh 52-week low of Rs 34.5 on 15 Jul 2026, marking a significant 51.56% drop over the past year amid persistent financial headwinds and market scepticism.
Read full news article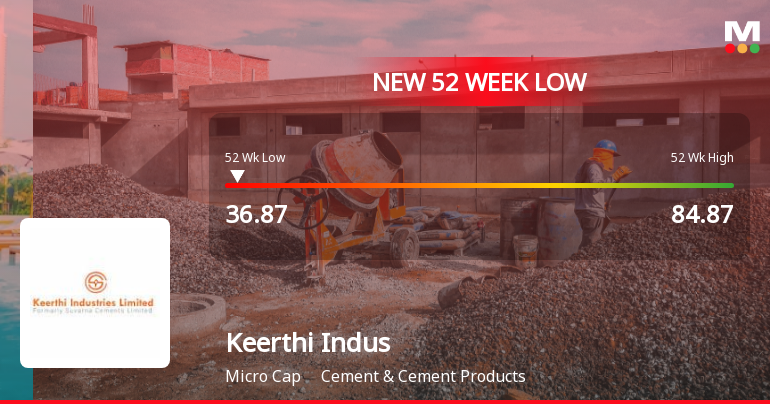
Keerthi Industries Ltd Falls to 52-Week Low of Rs 36.87 as Sell-Off Deepens
A sharp decline in Keerthi Industries Ltd has pushed the stock to a fresh 52-week low of Rs 36.87 on 14 Jul 2026, marking a near 50% drop over the past year and signalling sustained pressure amid weak financials and market sentiment.
Read full news article
Keerthi Industries Ltd is Rated Strong Sell
Keerthi Industries Ltd is rated Strong Sell by MarketsMOJO, with this rating last updated on 11 Mar 2024. However, the analysis and financial metrics discussed here reflect the company’s current position as of 08 July 2026, providing investors with an up-to-date view of its fundamentals, valuation, financial trends, and technical outlook.
Read full news article Announcements
Demand Notice Received By The Company Under Insolvency And Bankruptcy Code 2016
17-Jul-2026 | Source : BSEAs per the enclosed letter
Report On Re-Lodgement Of Transfer Requests For Physical Shares For The Month Ended 30Th June 2026.
03-Jul-2026 | Source : BSEAs per the enclosed letter
Compliances-Certificate under Reg. 74 (5) of SEBI (DP) Regulations 2018
03-Jul-2026 | Source : BSEAs per the enclosed letter
Corporate Actions

No Upcoming Board Meetings

Keerthi Industries Ltd has declared 15% dividend, ex-date: 15 Sep 22

No Splits history available

No Bonus history available

No Rights history available
Quality key factors
Valuation key factors
Technicals key factors
 Technical Indicator Scale: Bearish, Mildly Bearish, Sideways, Mildly Bullish, Bullish Turned
 Shareholding Snapshot : Jun 2026
Shareholding Compare (%holding)
Promoters
44.6536
Held by 0 Schemes
Held by 0 FIIs
Seshagiri Rao Jasti (38.44%)
Buradagunta Suguna (4.37%)
23.03%
Quarterly Results Snapshot (Standalone) - Mar'26 - QoQ

QoQ Growth in quarter ended Mar 2026 is 55.07% vs -29.31% in Dec 2025
QoQ Growth in quarter ended Mar 2026 is 69.12% vs -4.97% in Dec 2025
Half Yearly Results Snapshot (Standalone) - Sep'25
Growth in half year ended Sep 2025 is -1.94% vs -48.80% in Sep 2024
Growth in half year ended Sep 2025 is 21.80% vs 1.57% in Sep 2024
Nine Monthly Results Snapshot (Standalone) - Dec'25
YoY Growth in nine months ended Dec 2025 is -12.67% vs -51.23% in Dec 2024
YoY Growth in nine months ended Dec 2025 is 28.05% vs -67.77% in Dec 2024
Annual Results Snapshot (Standalone) - Mar'26
YoY Growth in year ended Mar 2026 is -3.19% vs -54.43% in Mar 2025
YoY Growth in year ended Mar 2026 is 32.85% vs -45.12% in Mar 2025
About Keerthi Industries Ltd

Company Coordinates


