
Compare Keltech Energies with Similar Stocks
Dashboard
Strong ability to service debt as the company has a low Debt to EBITDA ratio of 1.76 times
Healthy long term growth as Operating profit has grown by an annual rate 32.55%
Flat results in Mar 26
With ROCE of 17.3, it has a Very Expensive valuation with a 4.5 Enterprise value to Capital Employed
Despite the size of the company, domestic mutual funds hold only 0% of the company
Consistent Returns over the last 3 years
Stock DNA
Other Chemical products
INR 832 Cr (Micro Cap)
31.00
46
0.02%
0.26
17.20%
5.61
Total Returns (Price + Dividend) 
Latest dividend: 1.4952457002457002 per share ex-dividend date: Aug-04-2025
Risk Adjusted Returns v/s
Returns Beta

News

Keltech Energies Ltd is Rated Hold
Keltech Energies Ltd is rated 'Hold' by MarketsMOJO, with this rating last updated on 26 May 2026. However, the analysis and financial metrics discussed here reflect the stock's current position as of 12 July 2026, providing investors with an up-to-date view of the company’s fundamentals, returns, and market standing.
Read full news article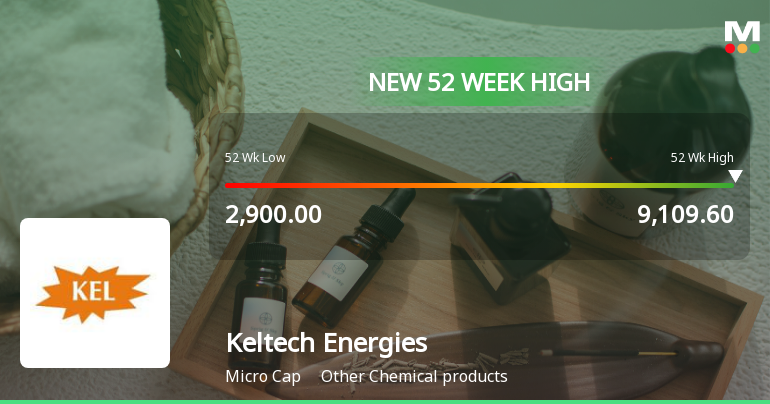
Broad-Based Technical Strength Lifts Keltech Energies Ltd to 52-Week High of Rs 9109.6
Surging past the Rs 9,100 mark, Keltech Energies Ltd has reached a new 52-week high on 8 Jul 2026, capping a remarkable rally that has more than tripled its share price from the 52-week low of Rs 2,900. This milestone reflects a powerful alignment of technical indicators and sustained price momentum, even as the broader market trades lower.
Read full news article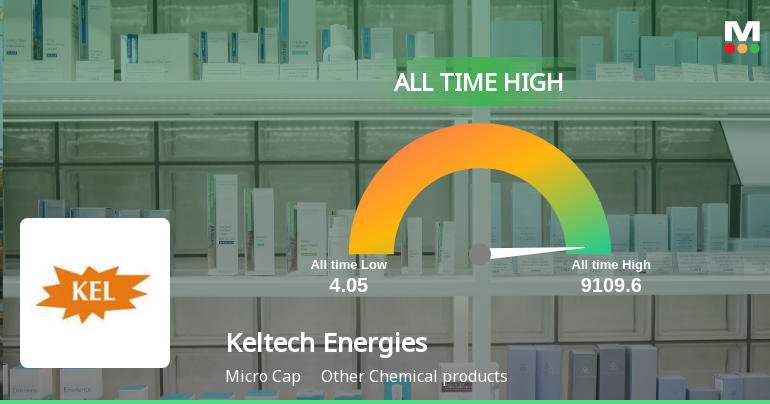
Announcements
Announcement under Regulation 30 (LODR)-Newspaper Publication
14-Jul-2026 | Source : BSENews Paper Publication for Notice of AGM
Compliances-Certificate under Reg. 74 (5) of SEBI (DP) Regulations 2018
14-Jul-2026 | Source : BSERegulation 74(5) of SEBI(DP) Regulation
Announcement under Regulation 30 (LODR)-Date of payment of Dividend
13-Jul-2026 | Source : BSESubmission of Record date for Final Payment of Dividend for the year 2025-26
Corporate Actions

No Upcoming Board Meetings

Keltech Energies Ltd has declared 15% dividend, ex-date: 31 Jul 26

No Splits history available

No Bonus history available

No Rights history available
Quality key factors
Valuation key factors
Technicals key factors
 Technical Indicator Scale: Bearish, Mildly Bearish, Sideways, Mildly Bullish, Bullish Turned
 Shareholding Snapshot : Jun 2026
Shareholding Compare (%holding)
Promoters
None
Held by 0 Schemes
Held by 0 FIIs
Chowgule And Company Pvt Ltd (40.99%)
Investor Education And Protection Fund Authority Ministry Of Corporate Affairs (2.51%)
38.28%
Quarterly Results Snapshot (Standalone) - Mar'26 - YoY

YoY Growth in quarter ended Mar 2026 is 2.29% vs 14.55% in Mar 2025

YoY Growth in quarter ended Mar 2026 is 22.67% vs 10.79% in Mar 2025
Half Yearly Results Snapshot (Standalone) - Sep'25
Growth in half year ended Sep 2025 is 12.71% vs -0.61% in Sep 2024
Growth in half year ended Sep 2025 is 17.06% vs 39.41% in Sep 2024
Nine Monthly Results Snapshot (Standalone) - Dec'25
YoY Growth in nine months ended Dec 2025 is 11.51% vs 6.21% in Dec 2024
YoY Growth in nine months ended Dec 2025 is 11.96% vs 36.71% in Dec 2024
Annual Results Snapshot (Standalone) - Mar'26
YoY Growth in year ended Mar 2026 is 8.71% vs 8.92% in Mar 2025
YoY Growth in year ended Mar 2026 is 14.92% vs 28.49% in Mar 2025
About Keltech Energies Ltd

Company Coordinates


