
Compare Kemistar Corp. with Similar Stocks
Dashboard
Weak Long Term Fundamental Strength with an average Return on Equity (ROE) of 3.75%
- Poor long term growth as Net Sales has grown by an annual rate of 13.94% and Operating profit at 6.96% over the last 5 years
- Company's ability to service its debt is weak with a poor EBIT to Interest (avg) ratio of 0.83
With ROCE of 3.2, it has a Expensive valuation with a 2.3 Enterprise value to Capital Employed
Underperformed the market in the last 1 year
Stock DNA
Specialty Chemicals
INR 54 Cr (Micro Cap)
102.00
23
0.33%
0.45
2.91%
2.96
Total Returns (Price + Dividend) 
Latest dividend: 0.3 per share ex-dividend date: Sep-23-2025
Risk Adjusted Returns v/s
Returns Beta

News

Kemistar Corporation Ltd is Rated Strong Sell
Kemistar Corporation Ltd is rated Strong Sell by MarketsMOJO. This rating was last updated on 24 Nov 2025. However, the analysis and financial metrics discussed below reflect the stock’s current position as of 10 July 2026, providing investors with an up-to-date view of the company’s fundamentals, valuation, financial trend, and technical outlook.
Read full news article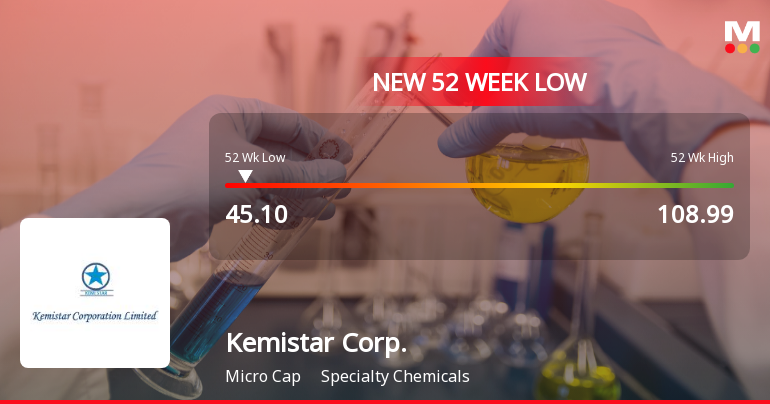
Kemistar Corporation Ltd Falls to 52-Week Low of Rs 45.1 as Sell-Off Deepens
A sharp decline in Kemistar Corporation Ltd has pushed the stock to a fresh 52-week low of Rs 45.1 on 2 Jul 2026, marking a significant 9.04% intraday drop and extending the stock’s underperformance amid a rising broader market.
Read full news article
Kemistar Corporation Ltd is Rated Strong Sell
Kemistar Corporation Ltd is rated Strong Sell by MarketsMOJO, with this rating last updated on 24 Nov 2025. However, the analysis and financial metrics discussed here reflect the stock’s current position as of 29 June 2026, providing investors with the latest insights into its performance and outlook.
Read full news article Announcements
Compliances-Certificate under Reg. 74 (5) of SEBI (DP) Regulations 2018
02-Jul-2026 | Source : BSECertificate under Regulation 74(5) of SEBI (Depositories and Participants) Regulations 2018 for the quarter ended on June 30 2026
Closure of Trading Window
25-Jun-2026 | Source : BSEIntimation of Closure of Trading window
Announcement under Regulation 30 (LODR)-Newspaper Publication
01-Jun-2026 | Source : BSENewspaper Publication of Results.
Corporate Actions

No Upcoming Board Meetings

Kemistar Corporation Ltd has declared 3% dividend, ex-date: 23 Sep 25

No Splits history available

No Bonus history available

No Rights history available
Quality key factors
Valuation key factors
Technicals key factors
 Technical Indicator Scale: Bearish, Mildly Bearish, Sideways, Mildly Bullish, Bullish Turned
 Shareholding Snapshot : Jun 2026
Shareholding Compare (%holding)
Promoters
None
Held by 0 Schemes
Held by 0 FIIs
Ketankumar Parashottamdas Patel (27.39%)
Kirit Jivrajbhai Patel (1.4%)
22.31%
Quarterly Results Snapshot (Consolidated) - Mar'26 - YoY

YoY Growth in quarter ended Mar 2026 is 42.96% vs 67.78% in Mar 2025
YoY Growth in quarter ended Mar 2026 is 44.83% vs 52.63% in Mar 2025
Half Yearly Results Snapshot (Consolidated) - Sep'25

Growth in half year ended Sep 2025 is 54.67% vs 43.22% in Sep 2024
Growth in half year ended Sep 2025 is -53.85% vs 18.18% in Sep 2024
Nine Monthly Results Snapshot (Consolidated) - Dec'25
YoY Growth in nine months ended Dec 2025 is 52.07% vs 61.63% in Dec 2024
YoY Growth in nine months ended Dec 2025 is -59.38% vs -11.11% in Dec 2024
Annual Results Snapshot (Consolidated) - Mar'26
YoY Growth in year ended Mar 2026 is 48.62% vs 63.87% in Mar 2025
YoY Growth in year ended Mar 2026 is -6.67% vs 13.21% in Mar 2025
About Kemistar Corporation Ltd

Company Coordinates


