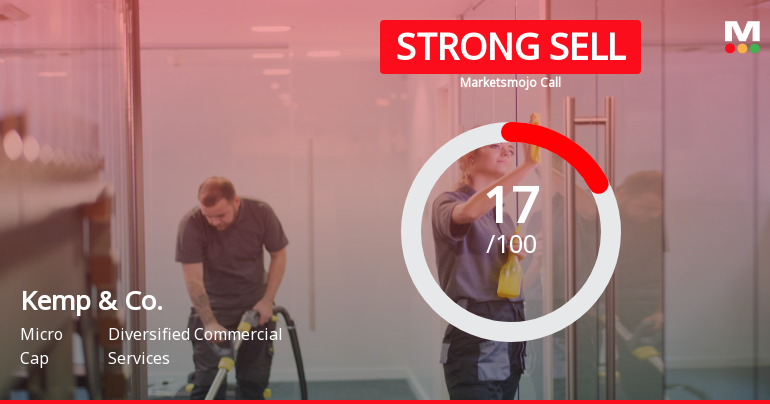
Kemp & Co.

  • Market Cap: Micro Cap
  • Industry: Diversified Commercial Services
  • ISIN: INE060E01018
  • NSEID:
  • BSEID: 506530
INR
1,078.85
51.35 (5.0%)
BSENSE

Aug 12, 03:30 PM

BSE+NSE Vol: 11

  • Price Points
  • Score
  • Mojo Parameters
  • Total Return
  • News and Corporate Actions
  • Key factors
  • Shareholding
  • Financials
  • CompanyCV
stock-summaryPrice Point
High/Low

1Day

52 Week

Valuation
Technical
Day's Volume

CASH

11 (-16.67%) Volume

Shareholding (Jun 2026)

FII

0.00%

Held by 0 FIIs

DII

0.09%

Held by 0 DIIs

Promoter

74.88%

Why is Kemp & Co Ltd falling/rising?

12-Aug-2026

As of 11-Aug, Kemp & Co Ltd's stock price is declining, currently at 1,027.50, down 4.88%. The stock has underperformed its sector and is trading below all key moving averages, indicating a bearish trend and reduced investor interest.

As of 11-Aug, Kemp & Co Ltd's stock price is falling, currently at 1,027.50, which reflects a decrease of 52.75 or 4.88%. This decline is evident in the stock's performance over various periods, with a 1-week drop of 4.24% and a 1-month decrease of 9.72%, while the benchmark Sensex has shown much smaller declines of 0.35% and an increase of 0.75% respectively. Year-to-date, the stock is down 8.42%, slightly worse than the Sensex's decline of 8.29%.<BR><BR>Today's trading performance indicates that the stock has underperformed its sector by 4.21%. It has also shown erratic trading patterns, not trading on 3 out of the last 20 days. The stock reached an intraday high of Rs 1,134.25 but fell to a low of Rs 1,027.05, indicating significant volatility. The weighted average price suggests that more volume was traded closer to the low price, further indicating bearish sentiment.<BR><BR>Moreover, Kemp & Co Ltd is trading below its 5-day, 20-day, 50-day, 100-day, and 200-day moving averages, which typically signals a downward trend. There has also been a notable decline in investor participation, with delivery volume on August 10 dropping by 46.81% compared to the 5-day average. This lack of interest from investors contributes to the stock's falling price. Overall, these factors collectively explain the decline in Kemp & Co Ltd's stock price.

View full answer

Are Kemp & Co Ltd latest results good or bad?

05-Aug-2026

Kemp & Co Ltd's latest results are mixed but lean negative, showing a net profit of ₹0.75 crore and 72% revenue growth from a low base, yet heavily reliant on non-operating income and facing operational challenges, with a negative return on equity of -1.34%. Overall, the company's fundamental issues suggest unfavorable prospects for future performance.

Kemp & Co Ltd's latest results present a mixed picture, leaning towards the negative due to underlying operational challenges despite some headline improvements. <BR><BR>In Q1 FY27, the company reported a net profit of ₹0.75 crore, which is a significant improvement from a loss of ₹1.01 crore in the previous quarter. Revenue also saw a robust year-on-year growth of 72%, reaching ₹1.29 crores. However, this growth comes from a very low sales base, and the operating profit margin remains weak at just 6.2%. <BR><BR>A critical concern is the company's heavy reliance on non-operating income, which amounted to ₹1.37 crores, making up 126.85% of profit before tax. This dependency raises red flags about the sustainability of its profitability, as the core business continues to struggle.<BR><BR>Additionally, the return on equity (ROE) is negative at -1.34%, indicating that the company is currently destroying shareholder value rather than creating it. The stock has also underperformed significantly over the past year, declining by 30.30%, which is much worse than the broader market.<BR><BR>In summary, while there are some positive signs in terms of revenue growth and a return to profitability, the fundamental issues regarding operational efficiency and reliance on non-operating income suggest that the overall results are not favorable. The company faces significant challenges that could hinder its future performance.

View full answer

Should I buy, sell or hold Kemp & Co Ltd?

05-Aug-2026

When is the next results date for Kemp & Co Ltd?

30-Jul-2026

The next results date for Kemp & Co Ltd is 04 August 2026.

The next results date for Kemp & Co Ltd is scheduled for 04 August 2026.

View full answer

How big is Kemp & Co.?

11-Jun-2026

As of 10th June, Kemp & Co Ltd has a market capitalization of 109.00 Cr, with net sales of 2.99 Cr and a loss of 2.21 Cr over the latest four quarters. Shareholder's funds are reported at 129.54 Cr, and total assets amount to 129.86 Cr.

As of 10th June, Kemp & Co Ltd has a market capitalization of 109.00 Cr, categorizing it as a Micro Cap company.<BR><BR>In the latest four quarters, Kemp & Co reported Net Sales of 2.99 Cr. However, the company experienced a loss of 2.21 Cr during the same period.<BR><BR>The latest annual period for the balance sheet is March 2025. Shareholder's Funds are reported at 129.54 Cr, while Total Assets amount to 129.86 Cr.

View full answer

Who are in the management team of Kemp & Co.?

11-Jun-2026

The management team of Kemp & Co. includes Shalini Piramal (Managing Director), D G Piramal, M K Arora (both Non-Executive Directors), and independent directors Raj Kataria and Satyen B Dalal, along with Maneck Davar (Director).

The management team of Kemp & Co. includes the following individuals:<BR><BR>1. D G Piramal - Non-Executive & Non-Independent Director<BR>2. Shalini Piramal - Managing Director<BR>3. Raj Kataria - Independent Non-Executive Director<BR>4. Satyen B Dalal - Independent Non-Executive Director<BR>5. M K Arora - Non-Executive & Non-Independent Director<BR>6. Maneck Davar - Director<BR><BR>If you need more information about their roles or the company, feel free to ask!

View full answer

Who are the peers of the Kemp & Co.?

11-Jun-2026

Kemp & Co.'s peers include Ruchi Infrastr., TCI Industries, Coral India Fin., Motor & Gen Fin, Droneacharya Aer, NIS Management, MILGREY FIN.&INV, and Nukleus Office. TCI Industries has the highest 1-year return at 15.74%, while Kemp & Co. has a return of -22.95%.

Peers: The peers of Kemp & Co. are Ruchi Infrastr., TCI Industries, Coral India Fin., Motor & Gen Fin, Droneacharya Aer, NIS Management, MILGREY FIN.&INV, and Nukleus Office.<BR><BR>Quality Snapshot: Below Average management risk is observed at Ruchi Infrastr., TCI Industries, Coral India Fin., Motor & Gen Fin, Kemp & Co., Droneacharya Aer, and Nukleus Office, while Average management risk is found at NIS Management. Growth ratings show that Average growth is present at TCI Industries and Motor & Gen Fin, while Below Average growth is noted for Ruchi Infrastr., Coral India Fin., Kemp & Co., Droneacharya Aer, and the rest. In terms of Capital Structure, Excellent ratings are seen at Coral India Fin. and Motor & Gen Fin, Good at NIS Management, and Below Average at Ruchi Infrastr., TCI Industries, Kemp & Co., Droneacharya Aer, Nukleus Office, and the rest.<BR><BR>Return Snapshot: The peer with the highest 1-year return is TCI Industries at 15.74%, while the lowest is Droneacharya Aer at -57.60%. Kemp & Co.'s own 1-year return is -22.95%, which is significantly lower than TCI Industries but higher than Droneacharya Aer. Additionally, the six-month return is negative for Ruchi Infrastr., Coral India Fin., Motor & Gen Fin, Droneacharya Aer, NIS Management, MILGREY FIN.&INV, and the rest.

View full answer

What does Kemp & Co. do?

10-Jun-2026

Kemp & Co Ltd manufactures and trades pharmaceutical products and is categorized as a Micro Cap company. As of March 2026, it reported net sales of 1 Cr and a net profit of -1 Cr, with a market cap of INR 109 Cr.

Overview:<BR>Kemp & Co Ltd is engaged in the manufacturing and trading of pharmaceutical products and operates within the Diversified Commercial Services industry, categorized as a Micro Cap company.<BR><BR>History:<BR>Kemp & Co Ltd was incorporated on June 27, 1982. The company has undergone various diversifications over the years, including a past venture into toy manufacturing, which has since been discontinued. The latest quarterly results reported net sales and net profit for the period ending March 2026.<BR><BR>Financial Snapshot:<BR>Most recent Net Sales: 1 Cr (Quarterly Results - Mar 2026) <BR>Most recent Net Profit: -1 Cr (Quarterly Results - Mar 2026) <BR>Market-cap value: INR 109 Cr (Micro Cap)<BR><BR>Key Metrics:<BR>P/E: N/A <BR>Industry P/E: 14 <BR>Dividend Yield: 0.00% <BR>Debt Equity: -0.50 <BR>Return on Equity: -1.34% <BR>Price to Book: 0.66<BR><BR>Contact Details:<BR>Address: 5th Floor DGP House, 88C Old Prabhadevi Road Mumbai Maharashtra : 400025 <BR>Tel: 91-22-6653-9000 <BR>Email: kemp-investor@kempnco.com <BR>Website: http://www.kempnco.com

View full answer

How has been the historical performance of Kemp & Co.?

09-Nov-2025

Kemp & Co. has experienced a declining trend in net sales and profitability, with net sales dropping from 3.26 Cr in Mar'19 to 2.91 Cr in Mar'25, and significant losses reported in recent periods, including a profit after tax decline from 0.52 Cr to a loss of 1.10 Cr. The company's reserves and shareholder equity have also significantly decreased, indicating ongoing financial challenges.

Answer:<BR>The historical performance of Kemp & Co. shows a declining trend in net sales and profitability over the years, with significant losses reported in recent periods.<BR><BR>Breakdown:<BR>Kemp & Co.'s net sales have decreased from 3.26 Cr in Mar'19 to 2.91 Cr in Mar'25, reflecting a downward trend. Total operating income has followed a similar pattern, dropping from 3.26 Cr in Mar'19 to 2.91 Cr in Mar'25. The company has consistently reported no raw material costs or other operating income, while the purchase of finished goods has varied, peaking at 0.89 Cr in Mar'20 and declining to 0.59 Cr in Mar'25. Employee costs have increased slightly from 1.12 Cr in Mar'19 to 1.31 Cr in Mar'25. Total expenditure has risen from 4.06 Cr in Mar'19 to 4.33 Cr in Mar'25, leading to operating losses, with operating profit (PBDIT) showing a significant decline from a profit of 0.37 Cr in Mar'19 to a loss of 1.15 Cr in Mar'25. Profit before tax has also worsened, moving from a profit of 0.12 Cr in Mar'19 to a loss of 1.24 Cr in Mar'25. Profit after tax has similarly deteriorated from a profit of 0.52 Cr in Mar'19 to a loss of 1.10 Cr in Mar'25. The company's reserves have decreased from 244.16 Cr in Mar'23 to 128.46 Cr in Mar'25, indicating a significant reduction in shareholder equity, which has fallen from 245.24 Cr in Mar'23 to 129.54 Cr in Mar'25. Cash flow from operating activities has remained negative, reflecting ongoing financial challenges. Overall, Kemp & Co. has faced declining revenues, increasing losses, and a reduction in equity over the past several years.

View full answer

Who are the top shareholders of the Kemp & Co.?

17-Jul-2025

The top shareholders of Kemp & Co. are Vibhuti Investments Company Limited with 68.12%, followed by public shareholder Gita Piramal at 20.05%. Individual investors collectively own 22.38%, with no mutual funds or foreign institutional investors holding shares.

The top shareholders of Kemp & Co. include Vibhuti Investments Company Limited, which holds the largest share at 68.12%. The highest public shareholder is Gita Piramal, with a stake of 20.05%. Additionally, individual investors collectively hold 22.38% of the company. There are no mutual funds or foreign institutional investors currently holding shares in Kemp & Co.

View full answer

Is Kemp & Co. overvalued or undervalued?

09-Jun-2025

As of April 25, 2023, Kemp & Co. is rated risky and overvalued due to troubling financial ratios, including a PE ratio of -132.36 and an EV to EBITDA of -101.65, despite a strong 1-year stock return of 49.76%.

As of 25 April 2023, the valuation grade for Kemp & Co. moved from does not qualify to risky, indicating a significant shift in its perceived financial stability. The company is currently assessed as overvalued, given its troubling financial ratios, including a PE ratio of -132.36, an EV to EBITDA of -101.65, and a ROCE of -1.17%. These figures suggest that the company's earnings and operational efficiency are under severe strain.<BR><BR>In comparison to its peers, Kemp & Co.'s valuation metrics are starkly unfavorable. For instance, MMTC, which is also rated risky, has a PE ratio of 119.39, while Optiemus Infra, rated fair, has an EV to EBITDA of 48.56. The stark contrast in these ratios highlights Kemp & Co.'s overvaluation relative to its peers. Additionally, while Kemp & Co. has shown a strong 1-year stock return of 49.76%, this performance is not sustainable given its current financial health and market conditions.

View full answer

What is the technical trend for Kemp & Co.?

09-Jun-2025

As of June 5, 2025, Kemp & Co. shows a mildly bullish trend based on daily moving averages, despite mixed signals from weekly and monthly indicators, including bearish MACD and KST readings.

As of 5 June 2025, the technical trend for Kemp & Co. has changed from sideways to mildly bullish. The daily moving averages indicate a mildly bullish stance, while the weekly and monthly MACD readings are mildly bearish. The Bollinger Bands show a bullish trend on the monthly timeframe, which supports the overall mildly bullish outlook. However, the weekly KST and Dow Theory remain bearish, suggesting some caution. The RSI shows no signal on both weekly and monthly timeframes, indicating a lack of momentum. Overall, the current technical stance is mildly bullish, but with mixed signals from various indicators.

View full answer

Has Kemp & Co. declared dividend?

06-Jun-2025

Yes, Kemp & Co. has declared a dividend of 120%, amounting to $12 per share, with an ex-date of September 7, 2023. Despite this, the dividend yield is 0%, but the company has shown strong price appreciation over various periods.

Kemp & Co. has declared a dividend.<BR><BR>Dividend Details:<BR>- Percentage announced: 120%<BR>- Amount per share: 12<BR>- Ex-date: 07 Sep 23<BR><BR>Dividend Yield: 0%<BR><BR>Total Returns by Period:<BR>In the last 6 months, the price return was -15.27%, the dividend return was 0%, resulting in a total return of -15.27%.<BR><BR>Over the past year, the price return was 45.63%, with a dividend return of 0%, leading to a total return of 45.63%.<BR><BR>In the 2-year period, the price return was 55.82%, the dividend return was 1.30%, culminating in a total return of 57.12%.<BR><BR>For the 3-year period, the price return was 161.72%, the dividend return was 3.07%, resulting in a total return of 164.79%.<BR><BR>In the 4-year period, the price return was 213.45%, with a dividend return of 2.52%, leading to a total return of 215.97%.<BR><BR>Over the last 5 years, the price return was 273.31%, the dividend return was 4.55%, resulting in a total return of 277.86%.<BR><BR>Overall, while Kemp & Co. has declared a significant dividend, the dividend yield remains at 0%. The total returns over various periods show a strong performance in price appreciation, particularly over the longer term, indicating positive growth despite the lack of dividends in recent periods.

View full answer
iScoreScore
Click here to find our call on this stock
Strong Sell
Sell
Hold
Buy
Strong Buy

Dashboard

1

Weak Long Term Fundamental Strength with a -210.53% CAGR growth in Operating Profits over the last 5 years

  • Company's ability to service its debt is weak with a poor EBIT to Interest (avg) ratio of -1.71
  • The company has reported losses. Due to this company has reported negative ROCE
2

Flat results in Jun 26

3

Risky - Negative EBITDA

stock-summaryMojo Parameters

Mojo Parameters

Loading Valuation Snapshot...

Stock DNA

stock-summary
Industry

Diversified Commercial Services

stock-summary
Market cap

INR 111 Cr (Micro Cap)

stock-summary
P/E

NA (Loss Making)

stock-summary
Industry P/E

21

stock-summary
Dividend Yield

0.00%

stock-summary
Debt Equity

-0.50

stock-summary
Return on Equity

-0.73%

stock-summary
Price to Book

0.67

Revenue and Profits:
Net Sales:
1 Cr
(Quarterly Results - Jun 2026)
Net Profit:
1 Cr
stock-summaryTotal Returns
Total Returns (Price + Dividend) stock-summary
Dividend Yield (0%)
TimePeriod
Price Return
Dividend Return
Total Return
3 Months
-7.79%
0%
-7.79%
6 Months
0%
0%
0.0%
1 Year
0%
0%
0.0%
2 Years
4.35%
0%
4.35%
3 Years
0%
1.29%
1.29%
4 Years
0%
1.76%
1.76%
5 Years
38.32%
1.73%
40.05%

Latest dividend: 12 per share ex-dividend date: Sep-07-2023

Risk Adjusted Returns v/s stock-summary
Returns Beta
Icon
Beta has not been calculated since enough price history is not available
stock-summaryNews & Corporate Actions

News

Kemp & Co Gains 0.68%: Downgrade and Operational Struggles Shape the Week

Key Events This Week

3 Aug: Stock opens flat at Rs.1,073.00

5 Aug: Q1 FY27 results reveal fleeting profit but deep operational struggles

6 Aug: Downgrade to Strong Sell by MarketsMOJO due to weak fundamentals and bearish technicals

7 Aug: Week closes at Rs.1,080.25, up 0.68% for the week

Announcements stock-summary

Announcement under Regulation 30 (LODR)-Newspaper Publication

05-Aug-2026 | Source : BSE

Pursuant to Regulation 47(1)(b) read with Regulation 30 of SEBI LODR 2015 we hereby enclose copies of newspaper advertisement pertaining to the Unaudited Financial Results for the quarter ended 30th June 2026 published on 5th August 2026 in Business Standard and Pratahkal.

Announcement under Regulation 30 (LODR)-Newspaper Publication

05-Aug-2026 | Source : BSE

Pursuant to Regulation 30 read with Schedule III Para A of SEBI LODR 2015 we are enclosing herewith newspaper advertisement published in todays i.e. 5th August 2026 Free Press Journal (English) and Nav Shakti (Marathi) informing dispatch of intimation letters to shareholders whose equity shares are due for transfer to the DEMAT Account of the IEPF Authority.

Board Meeting Outcome for Outcome Of Board Meeting Held On Tuesday 4Th August 2026

04-Aug-2026 | Source : BSE

In continuation to our letter dated 29th July 2026 we wish to inform you that the Board of Directors at its meeting held today at 04.30 p.m. and concluded at 05.00 p.m. have approved the following: i. Un-audited Financial Results for the quarter ended 30th June 2026 along with statement showing Segment Wise Revenue Results and Capital Employed; and ii. Limited Review Report issued by Statutory Auditors; iii. Intimation of 145th Annual General Meeting of the Company. This is to inform you that the 145th AGM of the Members of the Company will be held on Friday 11th September 2026 at 03:00 p.m. (IST) through VC/OAVM Please take the above on your record and disseminate the same for the information of investors.

Corporate Actions stock-summary

stock-summary
BOARD MEETING

No Upcoming Board Meetings

stock-summary
DIVIDEND

Kemp & Co Ltd has declared 120% dividend, ex-date: 07 Sep 23

stock-summary
SPLITS

No Splits history available

stock-summary
BONUS

No Bonus history available

stock-summary
RIGHTS

No Rights history available

stock-summaryKey Factors

Quality key factors stock-summary

Factor
Value
Sales Growth (5y)
7.49%
EBIT Growth (5y)
-210.53%
EBIT to Interest (avg)
-1.71
Debt to EBITDA (avg)
Negative Net Debt
Net Debt to Equity (avg)
-0.50
Sales to Capital Employed (avg)
0.02
Tax Ratio
64.00%
Dividend Payout Ratio
0
Pledged Shares
0
Institutional Holding
0.09%
ROCE (avg)
-1.04%
ROE (avg)
0.18%

Valuation key factors

Factor
Value
P/E Ratio
NA (Loss Making)
Industry P/E
21
Price to Book Value
0.71
EV to EBIT
-9.58
EV to EBITDA
-12.32
EV to Capital Employed
0.41
EV to Sales
9.49
PEG Ratio
NA
Dividend Yield
NA
ROCE (Latest)
-4.31%
ROE (Latest)
-0.73%

Technicals key factors

Indicator
Weekly
Monthly
MACD
Mildly Bullish
Bearish
RSI
No Signal
No Signal
Bollinger Bands
Mildly Bullish
Mildly Bearish
Moving Averages
Bearish (Daily)
KST
Bullish
Bearish
Dow Theory
No Trend
Mildly Bullish
stock-summary Technical Indicator Scale: Bearish, Mildly Bearish, Sideways, Mildly Bullish, Bullish  Turned 
stock-summaryShareholding
Shareholding Snapshot : Jun 2026stock-summary
Shareholding Compare (%holding) stock-summary
Majority shareholders

Promoters

Pledged Promoter Holdings

None

Mutual Funds

Held by 0 Schemes

FIIs

Held by 0 FIIs

Promoter with highest holding

Piramal Vibhuti Investments Limited (68.12%)

Highest Public shareholder

Gita Piramal (20.05%)

Individual Investors Holdings

22.35%

stock-summaryFinancial
[
  {
    "link": "quarterly",
    "btn_text": "All Quarterly Results",
    "header": "Quarterly Results Snapshot (Standalone) - Jun'26 - QoQ",
    "rhs": [
      {
        "prefix": "Net Sales ",
        "suffix": "QoQ Growth in quarter ended Jun 2026 is 55.42% vs 12.16% in Mar 2026",
        "dir": 1
      },
      {
        "prefix": "Standalone Net Profit ",
        "suffix": "QoQ Growth in quarter ended Jun 2026 is 174.26% vs -50.75% in Mar 2026",
        "dir": 1
      }
    ],
    "table": {
      "header": [
        "Jun'26",
        "Mar'26",
        "Change(%)"
      ],
      "body": [
        {
          "field": "Net Sales",
          "val1": "1.29",
          "val2": "0.83",
          "chgp": "55.42%",
          "chgp_class": "positive"
        },
        {
          "field": "Operating Profit (PBDIT) excl Other Income",
          "val1": "0.08",
          "val2": "-2.02",
          "chgp": "103.96%",
          "chgp_class": "positive"
        },
        {
          "field": "Interest",
          "val1": "0.00",
          "val2": "0.00",
          "chgp": "",
          "chgp_class": "neutral"
        },
        {
          "field": "Exceptional Items",
          "val1": "0.00",
          "val2": "0.00",
          "chgp": "",
          "chgp_class": "neutral"
        },
        {
          "field": "Standalone Net Profit",
          "val1": "0.75",
          "val2": "-1.01",
          "chgp": "174.26%",
          "chgp_class": "positive"
        },
        {
          "field": "Operating Profit Margin (Excl OI)",
          "val1": "6.20%",
          "val2": "-243.37%",
          "chgp": "249.57%",
          "chgp_class": "positive"
        }
      ]
    }
  },
  {
    "link": "half-yearly",
    "btn_text": "All Half Yearly Results",
    "header": "Half Yearly Results Snapshot (Standalone) - Sep'25",
    "rhs": [
      {
        "prefix": "Net Sales ",
        "suffix": " Growth in half year ended Sep 2025 is 1.43% vs -5.41% in Sep 2024",
        "dir": 1
      },
      {
        "prefix": "Standalone Net Profit ",
        "suffix": " Growth in half year ended Sep 2025 is -3.92% vs -64.52% in Sep 2024",
        "dir": 1
      }
    ],
    "table": {
      "header": [
        "Sep'25",
        "Sep'24",
        "Change(%)"
      ],
      "body": [
        {
          "field": "Net Sales",
          "val1": "1.42",
          "val2": "1.40",
          "chgp": "1.43%",
          "chgp_class": "positive"
        },
        {
          "field": "Operating Profit (PBDIT) excl Other Income",
          "val1": "-0.72",
          "val2": "-0.86",
          "chgp": "16.28%",
          "chgp_class": "positive"
        },
        {
          "field": "Interest",
          "val1": "0.00",
          "val2": "0.00",
          "chgp": "",
          "chgp_class": "neutral"
        },
        {
          "field": "Exceptional Items",
          "val1": "0.00",
          "val2": "0.00",
          "chgp": "",
          "chgp_class": "neutral"
        },
        {
          "field": "Standalone Net Profit",
          "val1": "-0.53",
          "val2": "-0.51",
          "chgp": "-3.92%",
          "chgp_class": "negative"
        },
        {
          "field": "Operating Profit Margin (Excl OI)",
          "val1": "-50.70%",
          "val2": "-61.43%",
          "chgp": "10.73%",
          "chgp_class": "positive"
        }
      ]
    }
  },
  {
    "link": "nine-monthly",
    "btn_text": "All Nine Monthly Results",
    "header": "Nine Monthly Results Snapshot (Standalone) - Dec'25",
    "rhs": [
      {
        "prefix": "Net Sales ",
        "suffix": "YoY Growth in nine months ended Dec 2025 is 0.47% vs -2.71% in Dec 2024",
        "dir": 1
      },
      {
        "prefix": "Standalone Net Profit ",
        "suffix": "YoY Growth in nine months ended Dec 2025 is -64.38% vs -55.32% in Dec 2024",
        "dir": -1
      }
    ],
    "table": {
      "header": [
        "Dec'25",
        "Dec'24",
        "Change(%)"
      ],
      "body": [
        {
          "field": "Net Sales",
          "val1": "2.16",
          "val2": "2.15",
          "chgp": "0.47%",
          "chgp_class": "positive"
        },
        {
          "field": "Operating Profit (PBDIT) excl Other Income",
          "val1": "-1.09",
          "val2": "-1.17",
          "chgp": "6.84%",
          "chgp_class": "positive"
        },
        {
          "field": "Interest",
          "val1": "0.00",
          "val2": "0.00",
          "chgp": "",
          "chgp_class": "neutral"
        },
        {
          "field": "Exceptional Items",
          "val1": "0.00",
          "val2": "0.00",
          "chgp": "",
          "chgp_class": "neutral"
        },
        {
          "field": "Standalone Net Profit",
          "val1": "-1.20",
          "val2": "-0.73",
          "chgp": "-64.38%",
          "chgp_class": "negative"
        },
        {
          "field": "Operating Profit Margin (Excl OI)",
          "val1": "-50.46%",
          "val2": "-54.42%",
          "chgp": "3.96%",
          "chgp_class": "positive"
        }
      ]
    }
  },
  {
    "link": "annual",
    "btn_text": "All Annual Results",
    "header": "Annual Results Snapshot (Standalone) - Mar'26",
    "rhs": [
      {
        "prefix": "Net Sales ",
        "suffix": "YoY Growth in year ended Mar 2026 is 3.09% vs -1.36% in Mar 2025",
        "dir": 1
      },
      {
        "prefix": "Standalone Net Profit ",
        "suffix": "YoY Growth in year ended Mar 2026 is -100.91% vs -340.00% in Mar 2025",
        "dir": 1
      }
    ],
    "table": {
      "header": [
        "Mar'26",
        "Mar'25",
        "Change(%)"
      ],
      "body": [
        {
          "field": "Net Sales",
          "val1": "3.00",
          "val2": "2.91",
          "chgp": "3.09%",
          "chgp_class": "positive"
        },
        {
          "field": "Operating Profit (PBDIT) excl Other Income",
          "val1": "-3.09",
          "val2": "-1.42",
          "chgp": "-117.61%",
          "chgp_class": "negative"
        },
        {
          "field": "Interest",
          "val1": "0.00",
          "val2": "0.00",
          "chgp": "",
          "chgp_class": "neutral"
        },
        {
          "field": "Exceptional Items",
          "val1": "0.00",
          "val2": "0.00",
          "chgp": "",
          "chgp_class": "neutral"
        },
        {
          "field": "Standalone Net Profit",
          "val1": "-2.21",
          "val2": "-1.10",
          "chgp": "-100.91%",
          "chgp_class": "negative"
        },
        {
          "field": "Operating Profit Margin (Excl OI)",
          "val1": "-103.00%",
          "val2": "-48.80%",
          "chgp": "-54.20%",
          "chgp_class": "negative"
        }
      ]
    }
  }
]

Quarterly Results Snapshot (Standalone) - Jun'26 - QoQstock-summary

Jun'26
Mar'26
Change(%)
Net Sales
1.29
0.83
55.42%
Operating Profit (PBDIT) excl Other Income
0.08
-2.02
103.96%
Interest
0.00
0.00
Exceptional Items
0.00
0.00
Standalone Net Profit
0.75
-1.01
174.26%
Operating Profit Margin (Excl OI)
6.20%
-243.37%
249.57%
Values in Rs Cr.
Direction Arrows
Net Sales

QoQ Growth in quarter ended Jun 2026 is 55.42% vs 12.16% in Mar 2026

Direction Arrows
Standalone Net Profit

QoQ Growth in quarter ended Jun 2026 is 174.26% vs -50.75% in Mar 2026

Half Yearly Results Snapshot (Standalone) - Sep'25stock-summary

Sep'25
Sep'24
Change(%)
Net Sales
1.42
1.40
1.43%
Operating Profit (PBDIT) excl Other Income
-0.72
-0.86
16.28%
Interest
0.00
0.00
Exceptional Items
0.00
0.00
Standalone Net Profit
-0.53
-0.51
-3.92%
Operating Profit Margin (Excl OI)
-50.70%
-61.43%
10.73%
Values in Rs Cr.
Direction Arrows
Net Sales

Growth in half year ended Sep 2025 is 1.43% vs -5.41% in Sep 2024

Direction Arrows
Standalone Net Profit

Growth in half year ended Sep 2025 is -3.92% vs -64.52% in Sep 2024

Nine Monthly Results Snapshot (Standalone) - Dec'25stock-summary

Dec'25
Dec'24
Change(%)
Net Sales
2.16
2.15
0.47%
Operating Profit (PBDIT) excl Other Income
-1.09
-1.17
6.84%
Interest
0.00
0.00
Exceptional Items
0.00
0.00
Standalone Net Profit
-1.20
-0.73
-64.38%
Operating Profit Margin (Excl OI)
-50.46%
-54.42%
3.96%
Values in Rs Cr.
Direction Arrows
Net Sales

YoY Growth in nine months ended Dec 2025 is 0.47% vs -2.71% in Dec 2024

Direction Arrows
Standalone Net Profit

YoY Growth in nine months ended Dec 2025 is -64.38% vs -55.32% in Dec 2024

Annual Results Snapshot (Standalone) - Mar'26stock-summary

Mar'26
Mar'25
Change(%)
Net Sales
3.00
2.91
3.09%
Operating Profit (PBDIT) excl Other Income
-3.09
-1.42
-117.61%
Interest
0.00
0.00
Exceptional Items
0.00
0.00
Standalone Net Profit
-2.21
-1.10
-100.91%
Operating Profit Margin (Excl OI)
-103.00%
-48.80%
-54.20%
Values in Rs Cr.
Direction Arrows
Net Sales

YoY Growth in year ended Mar 2026 is 3.09% vs -1.36% in Mar 2025

Direction Arrows
Standalone Net Profit

YoY Growth in year ended Mar 2026 is -100.91% vs -340.00% in Mar 2025

stock-summaryCompany CV
About Kemp & Co Ltd stock-summary
stock-summary
Kemp & Co Ltd
Micro Cap
Diversified Commercial Services
Kemp & Co Limited was incorporated on June 27, 1982. The Company, after incorporation, was pursuing the business of manufacturing and trading of pharmaceutical products in Mumbai and other parts of India. Some of the dispensing outlets of the Company had become landmark locations e.g. Kemps Corner at Mumbai. The Company had gone through various diversifications from time to time including manufacturing of toys and components thereof, which was discontinued after a few years.
Company Coordinates stock-summary
Company Details
5th Floor DGP House, 88C Old Prabhadevi Road Mumbai Maharashtra : 400025
stock-summary
Tel: 91-22-6653-9000
stock-summary
kemp-investor@kempnco.com
Registrar Details
Link Intime India Pvt Ltd, C-13 Pannalal Silk Compound, L B S Marg, Bhandup , Mumbai