
Compare Kemper Corp. with Similar Stocks
Total Returns (Price + Dividend) 
Kemper Corp. for the last several years.
Risk Adjusted Returns v/s
News
Kemper Corp. Experiences Revision in Its Stock Evaluation Amid Mixed Market Signals
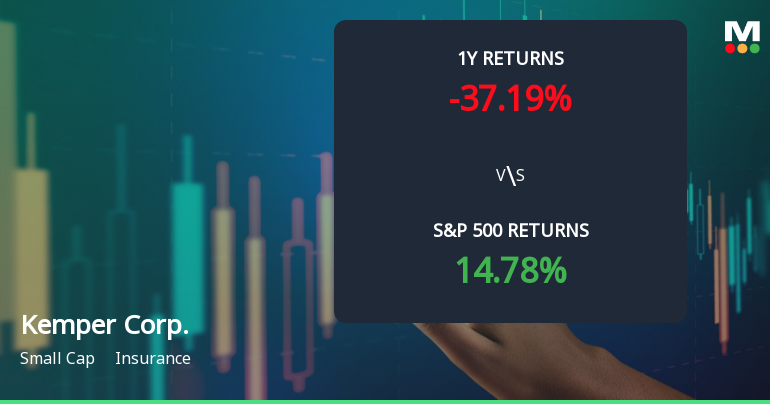
Kemper Corp., a small-cap insurance company, is experiencing mixed technical indicators amid challenging market conditions. While some metrics suggest short-term bullish momentum, others indicate a cautious outlook. The company has struggled significantly over the past year, with substantial declines compared to the broader S&P 500 index.
Read full news article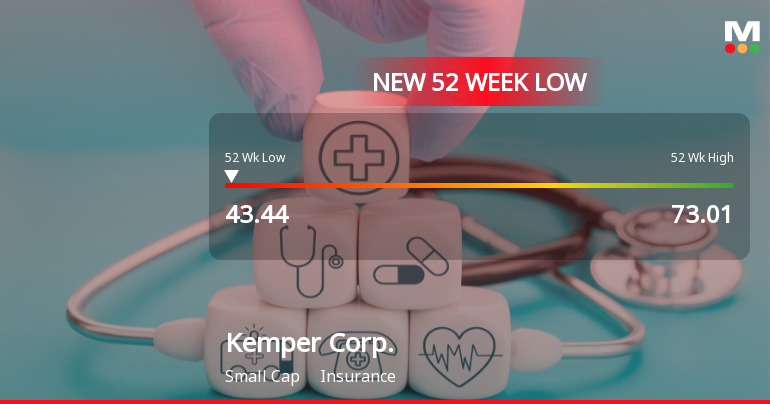
Kemper Corp. Stock Hits New 52-Week Low at $43.44
Kemper Corp. recently hit a 52-week low, reflecting a notable decline over the past year compared to the S&P 500. Despite this, the company has reported six consecutive quarters of positive financial results, with strong operating cash flow and net sales, alongside a solid return on equity and high institutional ownership.
Read full news article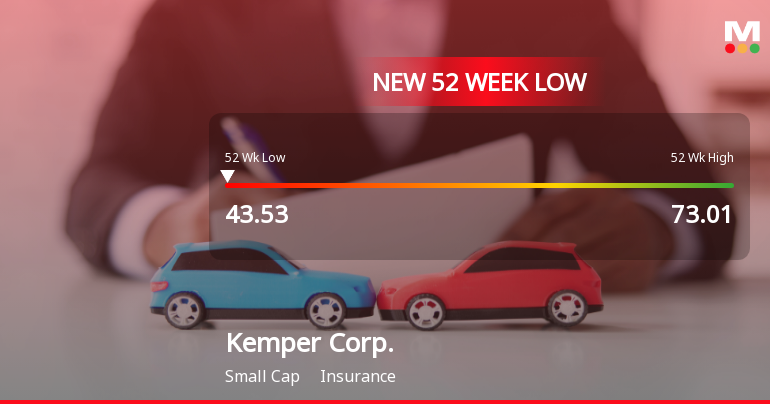
Kemper Corp. Stock Hits New 52-Week Low at $43.53
Kemper Corp. has reached a new 52-week low, reflecting a notable decline in its stock performance over the past year. Despite this, the company has reported strong operational results, including high operating cash flow and net sales, while maintaining solid institutional support.
Read full news article Announcements

Corporate Actions
Quality key factors
Valuation key factors
Technicals key factors
 Technical Indicator Scale: Bearish, Mildly Bearish, Sideways, Mildly Bullish, Bullish Turned
 Shareholding Snapshot : Sep 2025
Shareholding Compare (%holding)
Domestic Funds
Held in 80 Schemes (44.28%)
Held by 115 Foreign Institutions (10.09%)
Quarterly Results Snapshot (Consolidated) - Jun'25 - QoQ
QoQ Growth in quarter ended Jun 2025 is 0.00% vs 0.00% in Mar 2025

QoQ Growth in quarter ended Jun 2025 is -28.04% vs 1.36% in Mar 2025
Annual Results Snapshot (Consolidated) - Dec'24
YoY Growth in year ended Dec 2024 is 0.00% vs 0.00% in Dec 2023

YoY Growth in year ended Dec 2024 is 214.76% vs 4.99% in Dec 2023
About Kemper Corp.

Company Coordinates


