Kennametal India

  • Market Cap: Small Cap
  • Industry: Industrial Manufacturing
  • ISIN: INE717A01029
  • NSEID: KENNAMET
  • BSEID: 505890
INR
4,132.10
-99.9 (-2.36%)
BSENSE

Aug 25, 03:53 PM

BSE+NSE Vol: 30.94 k

  • Price Points
  • Score
  • Mojo Parameters
  • Total Return
  • News and Corporate Actions
  • Key factors
  • Shareholding
  • Financials
  • CompanyCV
stock-summaryPrice Point
High/Low

1Day

52 Week

Valuation
Technical
Day's Volume

CASH

30.94 k (-76.15%) Volume

Shareholding (Jun 2026)

FII

0.23%

Held by 30 FIIs

DII

13.34%

Held by 14 DIIs

Promoter

75.00%

Why is Kennametal India Ltd falling/rising?

25-Aug-2026

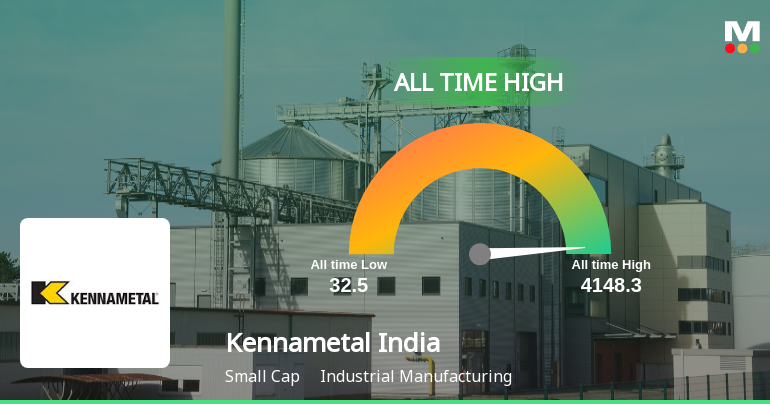
As of 24-Aug, Kennametal India Ltd's stock price is at 4,221.85, reflecting a 4.58% increase and a 51.90% rise over the past month. The company shows strong financial health with significant profit growth and is trading above its moving averages, indicating a bullish trend.

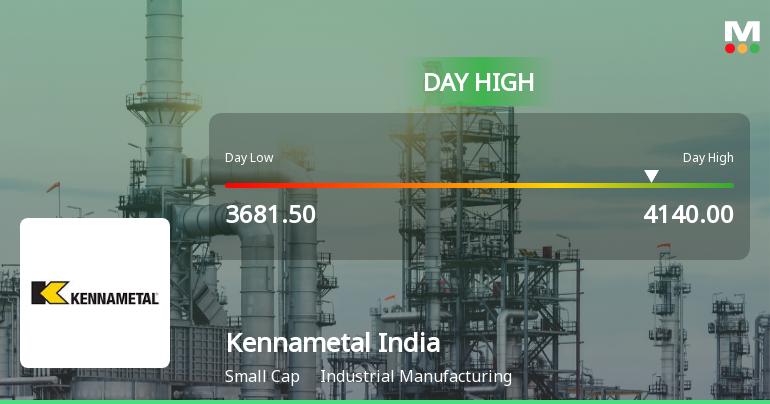
As of 24-Aug, Kennametal India Ltd's stock price is rising, currently at 4,221.85, reflecting an increase of 185.05 (4.58%). The stock has shown strong performance over various periods, with a remarkable 51.90% increase over the past month and a year-to-date rise of 101.50%, significantly outperforming the Sensex, which has declined by 9.21% during the same timeframe.<BR><BR>Today, the stock reached a new 52-week high of Rs. 4260, indicating positive momentum. It has been gaining for the last four consecutive days, accumulating a total return of 20.73% in this period. Additionally, it outperformed its sector by 4.62% today, which further supports the upward trend.<BR><BR>The company's financial performance has also been robust, with a net profit growth of 183.71% and outstanding quarterly results, including a profit before tax growth of 210.90%. This strong financial health, combined with the fact that the company is net-debt free and has a high return on equity (ROE) of 16.24%, contributes to investor confidence and the stock's rising price.<BR><BR>Moreover, Kennametal India is trading above its moving averages across multiple timeframes, indicating a bullish trend. Despite a slight decrease in investor participation, the overall market-beating performance and strong fundamentals suggest that the stock's price is likely to continue rising.

View full answer

Should I buy, sell or hold Kennametal India Ltd?

15-Aug-2026

Who are in the management team of Kennametal India?

14-Aug-2026

The management team of Kennametal India includes Chairman Bidadi Anjani Kumar, Managing Director Vijaykrishnan Venkatesan, and several directors, including independent and non-executive members, who collectively guide the company's strategic direction and operations.

The management team of Kennametal India includes the following individuals:<BR><BR>1. **Bidadi Anjani Kumar** - Chairman & Independent Director<BR>2. **Vinayak Kashinath Deshpande** - Independent Director<BR>3. **Devi Parameswar Reddy** - Director<BR>4. **Naveen Chandra Prakash** - General Manager & Company Secretary<BR>5. **Bhavna Bindra** - Independent Director<BR>6. **Vijaykrishnan Venkatesan** - Managing Director<BR>7. **Franklin Gerardo Castro** - Director<BR>8. **Kelly Marie Boyer** - Director<BR>9. **Kelly Golden Lynch** - Non-Executive Director<BR><BR>This team plays a crucial role in guiding the company's strategic direction and operations.

View full answer

What does Kennametal India do?

14-Aug-2026

Kennametal India Ltd manufactures and trades hard metal products and capital-intensive machines in the industrial manufacturing sector. As of June 2026, it reported net sales of ₹478 Cr and a net profit of ₹89 Cr, with a market cap of ₹8,014 Cr.

Overview:<BR>Kennametal India Ltd is engaged in the manufacturing and trading of hard metal products and capital-intensive machines, operating within the industrial manufacturing sector and classified as a small-cap company.<BR><BR>History:<BR>Kennametal India Ltd was incorporated on September 21, 1964, and was formerly known as Kennametal Widia India Limited until its name change on December 23, 2005. The latest quarterly results reported net sales and net profit for June 2026.<BR><BR>Financial Snapshot:<BR>Net Sales: 478 Cr (Quarterly Results - Jun 2026) <BR>Net Profit: 89 Cr (Quarterly Results - Jun 2026) <BR>Market Cap: INR 8,014 Cr (Small Cap)<BR><BR>Key Metrics:<BR>P/E: 58.00 <BR>Industry P/E: 36 <BR>Dividend Yield: 1.11% <BR>Debt-Equity: -0.22 <BR>Return on Equity: 18.53% <BR>Price to Book: 10.58 <BR><BR>Contact Details:<BR>Address: 8/9th Mile, Tumkur Road Bangalore Karnataka : 560073 <BR>Tel: 91-80-28394321 <BR>Email: in.investorrelation@kennametal.com <BR>Website: http://www.kennametal.com

View full answer

Who are the peers of the Kennametal India?

14-Aug-2026

Kennametal India's peers include Lloyds Engineering, Tega Industries, Titagarh Rail, Jupiter Wagons, Elecon Engineering, Dynamatic Technologies, Standard Engineering, Praj Industries, Centum Electronics, and Cyient DLM. Kennametal India has the highest 1-year return at 69.69%, while Tega Industries has the lowest at -9.43%.

Peers: The peers of Kennametal India are Lloyds Engineeri, Tega Inds., Titagarh Rail, Jupiter Wagons, Elecon Engg.Co, Dynamatic Tech., Standard Enginee, Praj Industries, Centum Electron, and Cyient DLM.<BR><BR>Quality Snapshot: Excellent management risk is observed at Lloyds Engineeri, Jupiter Wagons, Elecon Engg.Co, and Praj Industries, while Good management risk is found at Tega Inds., Titagarh Rail, Kennametal India, and Dynamatic Tech. Average management risk is present at Standard Enginee, Centum Electron, and Cyient DLM. Growth is Excellent at Lloyds Engineeri and Jupiter Wagons, Good at Kennametal India, and Below Average at Tega Inds., Elecon Engg.Co, and Praj Industries, while Average growth is noted at Titagarh Rail. Average growth is also seen at Dynamatic Tech., Standard Enginee, and Centum Electron. Capital Structure is Excellent at Lloyds Engineeri, Tega Inds., Jupiter Wagons, Elecon Engg.Co, and Praj Industries, while Average is noted at Titagarh Rail and Standard Enginee, and Below Average at Dynamatic Tech. and Centum Electron.<BR><BR>Return Snapshot: The peer with the highest 1-year return is Kennametal India at 69.69%, while the lowest is Tega Inds. at -9.43%, indicating that Kennametal India's performance is significantly better than Tega Inds. Additionally, peers such as Jupiter Wagons, Elecon Engg.Co, and Praj Industries have negative six-month returns.

View full answer

How big is Kennametal India?

14-Aug-2026

As of 14th August, Kennametal India Ltd has a market capitalization of 7,726.67 Cr, with recent Net Sales of 1,020.60 Cr and a Net Profit of 117.10 Cr.

As of 14th August, Kennametal India Ltd has a market capitalization of 7,726.67 Cr, which classifies it as a Small Cap company.<BR><BR>In the latest four quarters, Kennametal India reported Net Sales of 1,020.60 Cr and a Net Profit of 117.10 Cr.<BR><BR>The latest reporting period for the balance sheet is June 2022, showing Shareholder's Funds of 646.30 Cr and Total Assets of 827.60 Cr.

View full answer

When is the next results date for Kennametal India Ltd?

30-Jul-2026

The next results date for Kennametal India Ltd is 13 August 2026.

The next results date for Kennametal India Ltd is scheduled for 13 August 2026.

View full answer

Are Kennametal India Ltd latest results good or bad?

06-Feb-2026

Kennametal India Ltd's latest results show a year-on-year revenue growth of 16.38% and a net profit increase of 9.91%, indicating improvement compared to last year. However, challenges in maintaining operating margins suggest a need for cautious optimism moving forward.

Kennametal India Ltd's latest results present a mixed picture. In the quarter ended December 2025, the company reported a year-on-year revenue growth of 16.38%, which is a positive sign compared to the previous year's growth of just 5.98%. Additionally, the standalone net profit increased by 9.91%, rebounding from a decline of 10.84% in the same quarter last year. <BR><BR>However, while these figures indicate improvement, it's important to consider the context of their previous performance. In the earlier quarter (September 2022), the company experienced a slight decline in revenue of 0.48% quarter-on-quarter, although net profit showed a healthy increase of 12.10%. The operating margin has also been under pressure, reflecting challenges in maintaining profitability despite revenue growth.<BR><BR>Overall, the latest results suggest that Kennametal India is on an upward trajectory in terms of revenue and profit compared to the previous year, but the company still faces challenges in sustaining consistent growth and managing margins effectively. Investors may view these results as a cautiously optimistic sign, but ongoing scrutiny of operational performance is warranted.

View full answer

Is Kennametal India overvalued or undervalued?

05-Dec-2025

As of December 4, 2025, Kennametal India is considered overvalued with a very expensive valuation grade, reflected by a PE Ratio of 43.84, a Price to Book Value of 6.41, and an EV to EBITDA of 25.35, alongside a year-to-date stock decline of 26.52% compared to the Sensex's gain of 9.12%.

As of 4 December 2025, Kennametal India has moved from an expensive to a very expensive valuation grade. The company is currently considered overvalued. Key ratios include a PE Ratio of 43.84, a Price to Book Value of 6.41, and an EV to EBITDA of 25.35. <BR><BR>In comparison to peers, Kennametal India's PE Ratio is significantly higher than Rail Vikas, which stands at 57.4, and Tube Investments at 83.02, both of which are also categorized as very expensive. The company's recent stock performance shows a year-to-date decline of 26.52%, contrasting sharply with the Sensex's gain of 9.12%, further supporting the overvaluation assessment.

View full answer

How has been the historical performance of Kennametal India?

01-Dec-2025

Kennametal India has shown strong financial growth over the past four years, with net sales increasing from 705 Cr in June 2020 to 990.70 Cr in June 2022, and profit after tax rising from 33.90 Cr to 114.10 Cr. However, cash flow from operating activities declined significantly, resulting in a net cash outflow of 65 Cr in June 2022.

Answer:<BR>The historical performance of Kennametal India shows a positive trend in key financial metrics over the past four years.<BR><BR>Breakdown:<BR>Kennametal India's net sales increased from 705.00 Cr in June 2020 to 990.70 Cr in June 2022, reflecting a steady growth trajectory. The total operating income followed a similar pattern, rising from 705.00 Cr in June 2020 to 990.70 Cr in June 2022. Despite fluctuations in raw material costs and other expenditures, the total expenditure (excluding depreciation) rose from 634.10 Cr in June 2020 to 811.80 Cr in June 2022. Operating profit (PBDIT) also improved significantly, increasing from 83.50 Cr in June 2020 to 188.30 Cr in June 2022, with the operating profit margin rising from 10.06% to 18.06% in the same period. Profit before tax surged from 42.10 Cr in June 2020 to 152.60 Cr in June 2022, leading to a profit after tax of 114.10 Cr in June 2022, up from 33.90 Cr in June 2020. The earnings per share (EPS) showed a remarkable increase from 15.41 in June 2020 to 51.86 in June 2022. On the balance sheet, total assets grew from 699.20 Cr in June 2020 to 827.60 Cr in June 2022, while total liabilities increased from 699.20 Cr to 827.60 Cr, indicating a stable financial position. Cash flow from operating activities, however, decreased from 166.00 Cr in June 2021 to 49.00 Cr in June 2022, contributing to a net cash outflow of 65.00 Cr in June 2022. Overall, Kennametal India has demonstrated robust growth in sales and profitability, despite some challenges in cash flow management.

View full answer

Is Kennametal India technically bullish or bearish?

07-Nov-2025

As of November 6, 2025, Kennametal India shows a mildly bearish trend, with daily moving averages and weekly KST indicating bearish momentum, despite some mildly bullish signals from the MACD.

As of 6 November 2025, the technical trend for Kennametal India has changed from bearish to mildly bearish. The current stance is mildly bearish, driven primarily by the daily moving averages indicating a bearish outlook and the weekly KST also showing bearish momentum. The MACD on a weekly basis is mildly bullish, but the monthly view remains bearish, suggesting mixed signals. The Bollinger Bands are mildly bearish across both weekly and monthly time frames, further supporting the bearish sentiment. Overall, while there are some mildly bullish indicators, the prevailing trend remains bearish in strength.

View full answer

Who are the top shareholders of the Kennametal India?

17-Jul-2025

The top shareholders of Kennametal India include Meturit Ag with 51.0%, Nippon Life India Trustee Ltd with 8.89%, and individual investors with 9.13%. Additionally, 13 mutual fund schemes hold 13.49%, while foreign institutional investors own 0.88%, with no pledged promoter holdings reported.

The top shareholders of Kennametal India include Meturit Ag, which holds the largest stake at 51.0%. Other significant shareholders are Nippon Life India Trustee Ltd, representing the Nippon India Multi Cap Fund with an 8.89% holding, and individual investors who collectively own 9.13% of the company. Additionally, 13 mutual fund schemes hold a combined 13.49%, while foreign institutional investors (FIIs) account for 0.88% of the shares. There are no pledged promoter holdings reported.

View full answer

Has Kennametal India declared dividend?

06-Jun-2025

Yes, Kennametal India Ltd has declared a 400% dividend, amounting to ₹40 per share, with an ex-date of May 28, 2025. Despite recent negative price returns, the company has shown substantial total returns over longer periods, particularly a 248.69% total return over the last 5 years.

Kennametal India Ltd has declared a 400% dividend.<BR><BR>Dividend Details:<BR>- Percentage announced: 400%<BR>- Amount per share: 40<BR>- Ex-date: May 28, 2025<BR><BR>Dividend Yield: 1.63%.<BR><BR>Total Returns by Period:<BR>Over the last 6 months, the price return was -21.0%, the dividend return was 1.31%, resulting in a total return of -19.69%.<BR><BR>In the past year, the price return was -27.36%, the dividend return was 1.17%, leading to a total return of -26.19%.<BR><BR>Over the last 2 years, the price return was -2.54%, the dividend return was 2.70%, resulting in a total return of 0.16%.<BR><BR>In the past 3 years, the price return was 25.84%, the dividend return was 5.07%, leading to a total return of 30.91%.<BR><BR>Over the last 4 years, the price return was 102.11%, the dividend return was 9.37%, resulting in a total return of 111.48%.<BR><BR>In the past 5 years, the price return was 231.01%, the dividend return was 17.68%, leading to a total return of 248.69%.<BR><BR>Overall, Kennametal India has declared a significant dividend, and while the recent price returns have been negative, the total returns over longer periods indicate substantial growth, particularly over the last 5 years.

View full answer
iScoreScore
Part of MojoOne Strategy
Click here to find our call on this stock
Strong Sell
Sell
Hold
Buy
Strong Buy

Dashboard

1

High Management Efficiency with a high ROE of 16.24%

 
2

The company is Net-Debt Free

 
3

With a growth in Net Profit of 183.71%, the company declared Outstanding results in Jun 26

stock-summaryMojo Parameters

Mojo Parameters

Loading Valuation Snapshot...

Stock DNA

stock-summary
Industry

Industrial Manufacturing

stock-summary
Market cap

INR 9,084 Cr (Small Cap)

stock-summary
P/E

48.00

stock-summary
Industry P/E

35

stock-summary
Dividend Yield

0.94%

stock-summary
Debt Equity

-0.05

stock-summary
Return on Equity

22.96%

stock-summary
Price to Book

10.91

Revenue and Profits:
Net Sales:
478 Cr
(Quarterly Results - Jun 2026)
Net Profit:
89 Cr
stock-summaryTotal Returns
Total Returns (Price + Dividend) stock-summary
Dividend Yield (0.94%)
TimePeriod
Price Return
Dividend Return
Total Return
3 Months
36.37%
0%
36.37%
6 Months
0%
0%
0.0%
1 Year
0%
0%
0.0%
2 Years
0%
0%
0.0%
3 Years
51.28%
3.93%
55.21%
4 Years
79.07%
5.00%
84.07%
5 Years
202.58%
11.10%
213.68%

Latest dividend: 40 per share ex-dividend date: May-15-2026

Risk Adjusted Returns v/s stock-summary
Returns Beta
Icon
Beta has not been calculated since enough price history is not available
stock-summaryNews & Corporate Actions

News

stock-summaryKey Factors

Quality key factors stock-summary

Factor
Value
Sales Growth (5y)
13.24%
EBIT Growth (5y)
25.47%
EBIT to Interest (avg)
100.00
Debt to EBITDA (avg)
Net Debt is too low
Net Debt to Equity (avg)
-0.05
Sales to Capital Employed (avg)
1.56
Tax Ratio
26.40%
Dividend Payout Ratio
85.52%
Pledged Shares
0
Institutional Holding
13.57%
ROCE (avg)
23.31%
ROE (avg)
16.24%

Valuation key factors

Factor
Value
P/E Ratio
48
Industry P/E
35
Price to Book Value
10.91
EV to EBIT
36.27
EV to EBITDA
30.55
EV to Capital Employed
11.47
EV to Sales
6.14
PEG Ratio
0.53
Dividend Yield
0.94%
ROCE (Latest)
31.62%
ROE (Latest)
22.96%

Technicals key factors

Indicator
Weekly
Monthly
MACD
Bullish
Bullish
RSI
Bearish
Bearish
Bollinger Bands
Bullish
Bullish
Moving Averages
Bullish (Daily)
KST
Bullish
Bullish
Dow Theory
Bullish
Bullish
OBV
No Trend
Bullish
stock-summary Technical Indicator Scale: Bearish, Mildly Bearish, Sideways, Mildly Bullish, Bullish  Turned 
stock-summaryShareholding
Shareholding Snapshot : Jun 2026stock-summary
Shareholding Compare (%holding) stock-summary
Majority shareholders

Promoters

Pledged Promoter Holdings

None

Mutual Funds

Held by 7 Schemes (13.29%)

FIIs

Held by 30 FIIs (0.23%)

Promoter with highest holding

Meturit Ag (51.0%)

Highest Public shareholder

Nippon Life India Trustee Ltd-a/c Nippon India Multi Cap Fund (8.88%)

Individual Investors Holdings

9.29%

stock-summaryFinancial
[
  {
    "link": "quarterly",
    "btn_text": "All Quarterly Results",
    "header": "Quarterly Results Snapshot (Standalone) - Jun'26 - YoY",
    "rhs": [
      {
        "prefix": "Net Sales ",
        "suffix": "YoY Growth in quarter ended Jun 2026 is 47.68% vs 6.94% in Jun 2025",
        "dir": 1
      },
      {
        "prefix": "Standalone Net Profit ",
        "suffix": "YoY Growth in quarter ended Jun 2026 is 183.71% vs 3.30% in Jun 2025",
        "dir": 1
      }
    ],
    "table": {
      "header": [
        "Jun'26",
        "Jun'25",
        "Change(%)"
      ],
      "body": [
        {
          "field": "Net Sales",
          "val1": "477.60",
          "val2": "323.40",
          "chgp": "47.68%",
          "chgp_class": "positive"
        },
        {
          "field": "Operating Profit (PBDIT) excl Other Income",
          "val1": "129.00",
          "val2": "49.40",
          "chgp": "161.13%",
          "chgp_class": "positive"
        },
        {
          "field": "Interest",
          "val1": "0.00",
          "val2": "0.20",
          "chgp": "-100.00%",
          "chgp_class": "positive"
        },
        {
          "field": "Exceptional Items",
          "val1": "0.00",
          "val2": "0.00",
          "chgp": "",
          "chgp_class": "neutral"
        },
        {
          "field": "Standalone Net Profit",
          "val1": "88.80",
          "val2": "31.30",
          "chgp": "183.71%",
          "chgp_class": "positive"
        },
        {
          "field": "Operating Profit Margin (Excl OI)",
          "val1": "27.01%",
          "val2": "15.28%",
          "chgp": "11.73%",
          "chgp_class": "positive"
        }
      ]
    }
  },
  {
    "link": "half-yearly",
    "btn_text": "All Half Yearly Results",
    "header": "Half Yearly Results Snapshot (Standalone) - Dec'25",
    "rhs": [
      {
        "prefix": "Net Sales ",
        "suffix": " Growth in half year ended Dec 2025 is 13.02% vs 5.43% in Dec 2024",
        "dir": 1
      },
      {
        "prefix": "Standalone Net Profit ",
        "suffix": " Growth in half year ended Dec 2025 is 18.22% vs 12.38% in Dec 2024",
        "dir": 1
      }
    ],
    "table": {
      "header": [
        "Dec'25",
        "Dec'24",
        "Change(%)"
      ],
      "body": [
        {
          "field": "Net Sales",
          "val1": "630.00",
          "val2": "557.40",
          "chgp": "13.02%",
          "chgp_class": "positive"
        },
        {
          "field": "Operating Profit (PBDIT) excl Other Income",
          "val1": "97.50",
          "val2": "83.00",
          "chgp": "17.47%",
          "chgp_class": "positive"
        },
        {
          "field": "Interest",
          "val1": "0.10",
          "val2": "0.10",
          "chgp": "",
          "chgp_class": "neutral"
        },
        {
          "field": "Exceptional Items",
          "val1": "0.00",
          "val2": "0.00",
          "chgp": "",
          "chgp_class": "neutral"
        },
        {
          "field": "Standalone Net Profit",
          "val1": "55.80",
          "val2": "47.20",
          "chgp": "18.22%",
          "chgp_class": "positive"
        },
        {
          "field": "Operating Profit Margin (Excl OI)",
          "val1": "15.48%",
          "val2": "14.89%",
          "chgp": "0.59%",
          "chgp_class": "positive"
        }
      ]
    }
  },
  {
    "link": "nine-monthly",
    "btn_text": "All Nine Monthly Results",
    "header": "Nine Monthly Results Snapshot (Standalone) - Mar'26",
    "rhs": [
      {
        "prefix": "Net Sales ",
        "suffix": "YoY Growth in nine months ended Mar 2026 is 21.97% vs 6.21% in Mar 2025",
        "dir": 1
      },
      {
        "prefix": "Standalone Net Profit ",
        "suffix": "YoY Growth in nine months ended Mar 2026 is 49.72% vs -10.83% in Mar 2025",
        "dir": 1
      }
    ],
    "table": {
      "header": [
        "Mar'26",
        "Mar'25",
        "Change(%)"
      ],
      "body": [
        {
          "field": "Net Sales",
          "val1": "1,033.10",
          "val2": "847.00",
          "chgp": "21.97%",
          "chgp_class": "positive"
        },
        {
          "field": "Operating Profit (PBDIT) excl Other Income",
          "val1": "174.50",
          "val2": "122.90",
          "chgp": "41.99%",
          "chgp_class": "positive"
        },
        {
          "field": "Interest",
          "val1": "0.10",
          "val2": "0.20",
          "chgp": "-50.00%",
          "chgp_class": "positive"
        },
        {
          "field": "Exceptional Items",
          "val1": "0.00",
          "val2": "0.00",
          "chgp": "",
          "chgp_class": "neutral"
        },
        {
          "field": "Standalone Net Profit",
          "val1": "107.20",
          "val2": "71.60",
          "chgp": "49.72%",
          "chgp_class": "positive"
        },
        {
          "field": "Operating Profit Margin (Excl OI)",
          "val1": "16.89%",
          "val2": "14.51%",
          "chgp": "2.38%",
          "chgp_class": "positive"
        }
      ]
    }
  },
  {
    "link": "annual",
    "btn_text": "All Annual Results",
    "header": "Annual Results Snapshot (Standalone) - Jun'26",
    "rhs": [
      {
        "prefix": "Net Sales ",
        "suffix": "YoY Growth in year ended Jun 2026 is 29.09% vs 6.40% in Jun 2025",
        "dir": 1
      },
      {
        "prefix": "Standalone Net Profit ",
        "suffix": "YoY Growth in year ended Jun 2026 is 90.48% vs -6.88% in Jun 2025",
        "dir": 1
      }
    ],
    "table": {
      "header": [
        "Jun'26",
        "Jun'25",
        "Change(%)"
      ],
      "body": [
        {
          "field": "Net Sales",
          "val1": "1,510.70",
          "val2": "1,170.30",
          "chgp": "29.09%",
          "chgp_class": "positive"
        },
        {
          "field": "Operating Profit (PBDIT) excl Other Income",
          "val1": "303.70",
          "val2": "172.20",
          "chgp": "76.36%",
          "chgp_class": "positive"
        },
        {
          "field": "Interest",
          "val1": "0.30",
          "val2": "0.40",
          "chgp": "-25.00%",
          "chgp_class": "positive"
        },
        {
          "field": "Exceptional Items",
          "val1": "0.00",
          "val2": "0.00",
          "chgp": "",
          "chgp_class": "neutral"
        },
        {
          "field": "Standalone Net Profit",
          "val1": "196.00",
          "val2": "102.90",
          "chgp": "90.48%",
          "chgp_class": "positive"
        },
        {
          "field": "Operating Profit Margin (Excl OI)",
          "val1": "20.10%",
          "val2": "14.71%",
          "chgp": "5.39%",
          "chgp_class": "positive"
        }
      ]
    }
  }
]

Quarterly Results Snapshot (Standalone) - Jun'26 - YoYstock-summary

Jun'26
Jun'25
Change(%)
Net Sales
477.60
323.40
47.68%
Operating Profit (PBDIT) excl Other Income
129.00
49.40
161.13%
Interest
0.00
0.20
-100.00%
Exceptional Items
0.00
0.00
Standalone Net Profit
88.80
31.30
183.71%
Operating Profit Margin (Excl OI)
27.01%
15.28%
11.73%
Values in Rs Cr.
Direction Arrows
Net Sales

YoY Growth in quarter ended Jun 2026 is 47.68% vs 6.94% in Jun 2025

Direction Arrows
Standalone Net Profit

YoY Growth in quarter ended Jun 2026 is 183.71% vs 3.30% in Jun 2025

Half Yearly Results Snapshot (Standalone) - Dec'25stock-summary

Dec'25
Dec'24
Change(%)
Net Sales
630.00
557.40
13.02%
Operating Profit (PBDIT) excl Other Income
97.50
83.00
17.47%
Interest
0.10
0.10
Exceptional Items
0.00
0.00
Standalone Net Profit
55.80
47.20
18.22%
Operating Profit Margin (Excl OI)
15.48%
14.89%
0.59%
Values in Rs Cr.
Direction Arrows
Net Sales

Growth in half year ended Dec 2025 is 13.02% vs 5.43% in Dec 2024

Direction Arrows
Standalone Net Profit

Growth in half year ended Dec 2025 is 18.22% vs 12.38% in Dec 2024

Nine Monthly Results Snapshot (Standalone) - Mar'26stock-summary

Mar'26
Mar'25
Change(%)
Net Sales
1,033.10
847.00
21.97%
Operating Profit (PBDIT) excl Other Income
174.50
122.90
41.99%
Interest
0.10
0.20
-50.00%
Exceptional Items
0.00
0.00
Standalone Net Profit
107.20
71.60
49.72%
Operating Profit Margin (Excl OI)
16.89%
14.51%
2.38%
Values in Rs Cr.
Direction Arrows
Net Sales

YoY Growth in nine months ended Mar 2026 is 21.97% vs 6.21% in Mar 2025

Direction Arrows
Standalone Net Profit

YoY Growth in nine months ended Mar 2026 is 49.72% vs -10.83% in Mar 2025

Annual Results Snapshot (Standalone) - Jun'26stock-summary

Jun'26
Jun'25
Change(%)
Net Sales
1,510.70
1,170.30
29.09%
Operating Profit (PBDIT) excl Other Income
303.70
172.20
76.36%
Interest
0.30
0.40
-25.00%
Exceptional Items
0.00
0.00
Standalone Net Profit
196.00
102.90
90.48%
Operating Profit Margin (Excl OI)
20.10%
14.71%
5.39%
Values in Rs Cr.
Direction Arrows
Net Sales

YoY Growth in year ended Jun 2026 is 29.09% vs 6.40% in Jun 2025

Direction Arrows
Standalone Net Profit

YoY Growth in year ended Jun 2026 is 90.48% vs -6.88% in Jun 2025

stock-summaryCompany CV
About Kennametal India Ltd stock-summary
stock-summary
Kennametal India Ltd
Small Cap
Industrial Manufacturing
Kennametal India Limited (formerly known Kennametal Widia India Limited) was incorporated on September 21, 1964. The name of the Company was changed from Kennametal Widia India Ltd to Kennametal India Limited in December 23, 2005. Since then, the Company is engaged in the business of manufacturing and trading of hard metal products and manufacturing of capital intensive machines along with fixtures and spares.
Company Coordinates stock-summary
Company Details
8/9th Mile, Tumkur Road Bangalore Karnataka : 560073
stock-summary
Tel: 91-80-28394321
stock-summary
in.investorrelation@kennametal.com
Registrar Details
Integrated Enterprises (India) Ltd , 30, Ramana Residency, 4th Cross, Sampige Road, Malleswaram, Bangalore