
Compare Kenon Holdings Ltd. with Similar Stocks
Total Returns (Price + Dividend) 
Kenon Holdings Ltd. for the last several years.
Risk Adjusted Returns v/s
News
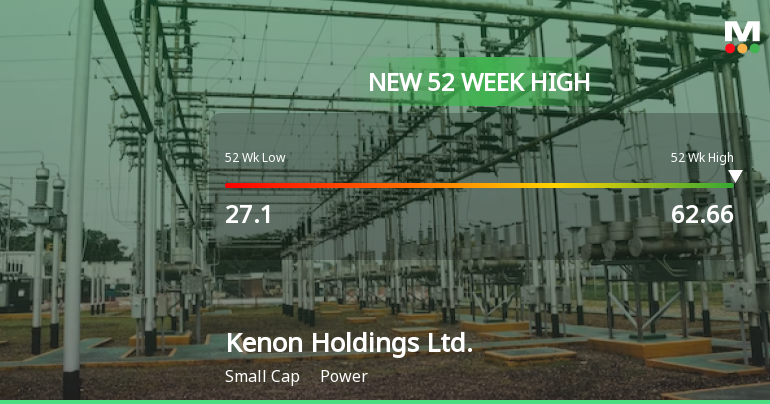
Kenon Holdings Hits New 52-Week High of USD 62.66, Up 153.48%
Kenon Holdings has achieved a new 52-week high of USD 62.66, reflecting a substantial one-year growth rate of 153.48%. With a market capitalization of USD 2,371 million, the company exhibits a P/E ratio of 28.00 and a conservative debt-to-equity ratio of 0.27, showcasing its resilience in the power industry.
Read full news article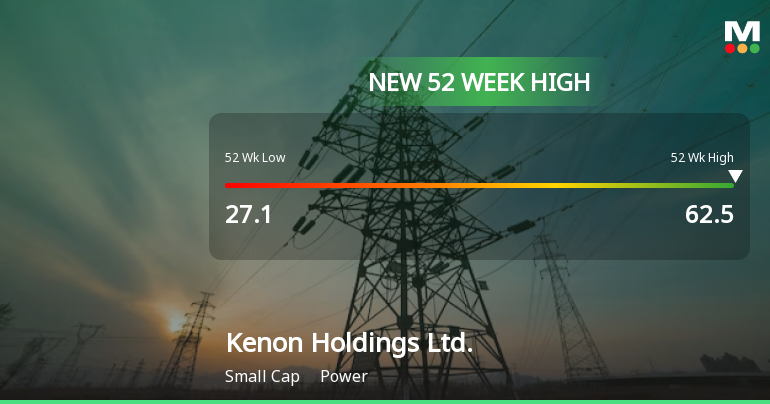
Kenon Holdings Hits New 52-Week High of $62.50, Up 152.75%
Kenon Holdings has achieved a new 52-week high of USD 62.50, reflecting a substantial increase over the past year. The company, with a market capitalization of USD 2,371 million, has a P/E ratio of 28.00 and a conservative debt-to-equity ratio of 0.27, despite a negative return on equity.
Read full news article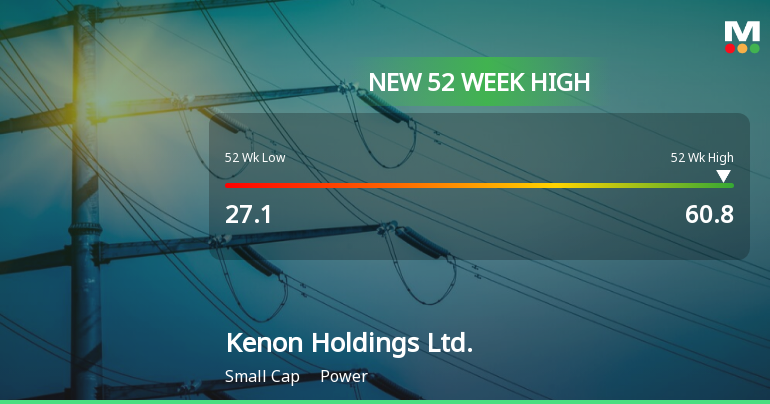
Kenon Holdings Hits New 52-Week High of $60.80, Up 142.88%
Kenon Holdings has achieved a new 52-week high of USD 60.80, marking a substantial increase in its stock performance over the past year. The company, with a market capitalization of USD 2,371 million, shows a P/E ratio of 28.00 and a low debt-to-equity ratio of 0.27.
Read full news article Announcements

Corporate Actions
Quality key factors
Valuation key factors
Technicals key factors
 Technical Indicator Scale: Bearish, Mildly Bearish, Sideways, Mildly Bullish, Bullish Turned
 Shareholding Snapshot : Sep 2025
Shareholding Compare (%holding)
Foreign Institutions
Held in 9 Schemes (1.53%)
Held by 32 Foreign Institutions (8.29%)
Quarterly Results Snapshot (Consolidated) - Sep'25 - QoQ

QoQ Growth in quarter ended Sep 2025 is 35.20% vs 7.10% in Jun 2025
QoQ Growth in quarter ended Sep 2025 is 1,016.67% vs -77.78% in Jun 2025
Annual Results Snapshot (Consolidated) - Dec'24

YoY Growth in year ended Dec 2024 is 8.60% vs 20.52% in Dec 2023
YoY Growth in year ended Dec 2024 is -5.71% vs -83.99% in Dec 2023
About Kenon Holdings Ltd.

Company Coordinates


