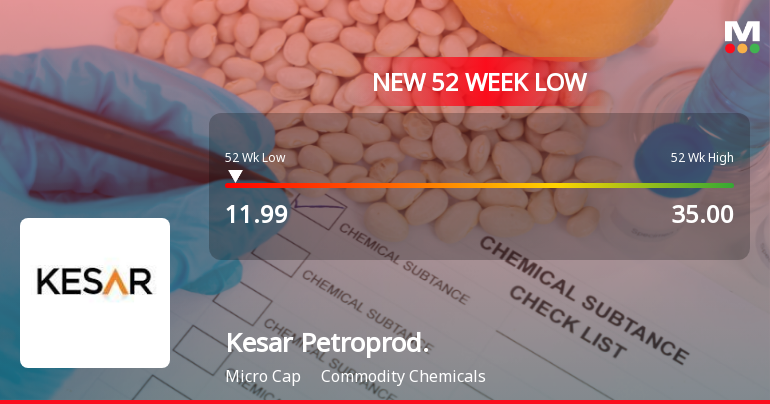
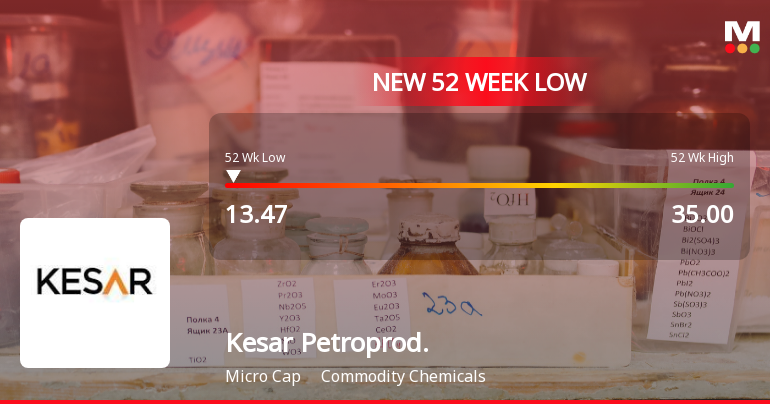
Kesar Petroprod.

  • Market Cap: Micro Cap
  • Industry: Commodity Chemicals
  • ISIN: INE133C01033
  • NSEID:
  • BSEID: 524174
INR
14.31
0.01 (0.07%)
BSENSE

Sep 02, 10:28 AM

BSE+NSE Vol: 12.62 k

  • Price Points
  • Score
  • Mojo Parameters
  • Total Return
  • News and Corporate Actions
  • Key factors
  • Shareholding
  • Financials
  • CompanyCV
stock-summaryPrice Point
High/Low

1Day

52 Week

Valuation
Technical
Day's Volume

CASH

12.62 k (-72.62%) Volume

Shareholding (Jun 2026)

FII

0.00%

Held by 0 FIIs

DII

0.13%

Held by 0 DIIs

Promoter

68.17%

Why is Kesar Petroproducts Ltd falling/rising?

02-Sep-2026

As of 01-Sep, Kesar Petroproducts Ltd's stock price is rising to Rs 14.30, reflecting a 12.78% increase. This rise is due to a trend reversal after prior declines, strong sector performance, increased investor participation, and greater promoter confidence, despite a challenging historical performance.

As of 01-Sep, Kesar Petroproducts Ltd's stock price is rising, currently at Rs 14.30, reflecting a change of 1.62 (12.78%) upward. This increase can be attributed to several factors. Firstly, the stock has shown a trend reversal, gaining after five consecutive days of decline, which may indicate a shift in investor sentiment. Additionally, the stock outperformed its sector by 15.02% today, suggesting a positive reception from the market.<BR><BR>Intraday, the stock reached a high of Rs 14.86, marking a significant increase of 17.19%, although it also experienced a low of Rs 12.42, indicating high volatility with an intraday volatility of 8.94%. The rising investor participation is also notable, with delivery volume increasing by 0.8% against the five-day average, suggesting renewed interest from investors.<BR><BR>Moreover, the company's promoters have increased their stake by 4.94% in the previous quarter, now holding 68.17% of the company, which reflects confidence in the company's future prospects. Despite the stock's poor performance over the past year, with a return of -52.25%, the long-term growth potential remains healthy, as indicated by an annual operating profit growth rate of 42.50%.<BR><BR>In summary, the stock's rise can be attributed to a combination of a trend reversal after previous declines, strong sector performance, increased investor participation, and rising promoter confidence, despite the backdrop of historical underperformance and financial challenges.

View full answer

Who are in the management team of Kesar Petroprod.?

01-Sep-2026

The management team of Kesar Petroprod includes Neelam Yashpal Arora, Kanyo D Fatnani, Satish Chand Mathur, and Nainesh Desai as independent directors; Parijat Vinod Kanetkar and Dinesh Shankarlal Sharma as non-executive directors; Ramjan Kadar Shaikh as whole-time director; and Saba Shaikh as Company Secretary & Compliance Officer. This diverse team ensures effective governance and operational oversight.

The management team of Kesar Petroprod includes the following individuals:<BR><BR>1. Neelam Yashpal Arora - Independent Director<BR>2. Kanyo D Fatnani - Independent Director<BR>3. Parijat Vinod Kanetkar - Non Executive Director<BR>4. Ramjan Kadar Shaikh - Whole-time Director<BR>5. Dinesh Shankarlal Sharma - Non Executive Director<BR>6. Saba Shaikh - Company Secretary & Compliance Officer<BR>7. Satish Chand Mathur - Independent Director<BR>8. Nainesh Desai - Independent Director<BR><BR>This team comprises a mix of independent and non-executive directors, along with a whole-time director and a compliance officer, contributing to the governance and operational oversight of the company.

View full answer

What does Kesar Petroprod. do?

01-Sep-2026

Kesar Petroproducts Ltd is a Micro Cap company specializing in the manufacture of Phthalocyanine Blue Crude within the Commodity Chemicals industry. As of June 2026, it reported net sales of 49 Cr and a net profit of 1 Cr.

Overview: <BR>Kesar Petroproducts Ltd is a leading manufacturer of Phthalocyanine Blue Crude, operating within the Commodity Chemicals industry and classified as a Micro Cap company.<BR><BR>History: <BR>Kesar Petroproducts Ltd was incorporated in January 1990. The latest quarterly results reported net sales and net profit for June 2026.<BR><BR>Financial Snapshot: <BR>Net Sales: 49 Cr (Quarterly Results - Jun 2026) <BR>Net Profit: 1 Cr (Quarterly Results - Jun 2026) <BR>Market Cap: INR 149 Cr (Micro Cap)<BR><BR>Key Metrics: <BR>P/E: 33.00 <BR>Industry P/E: 21 <BR>Dividend Yield: 0.00% <BR>Debt-Equity: 0.39 <BR>Return on Equity: 2.87% <BR>Price to Book: 0.98<BR><BR>Contact Details: <BR>Address: D-7/1 MIDC Industrial Area, Lote Parshuram Taluka - Khed Ratnagiri Maharashtra : 415722 <BR>Tel: 91-02356-272339 <BR>Email: info@kesarpetroproducts.com <BR>Website: http://www.kesarpetroproducts.com

View full answer

Who are the peers of the Kesar Petroprod.?

01-Sep-2026

Kesar Petroprod.'s peers include IVP, ARCL Organics, ZR2 Bioenergy, Kanchi Karpooram, Archit Organosys, Sh. Hari Chem., AG Ventures, Polychem, and Ritesh Intl. Notably, Sh. Hari Chem. has the highest 1-year return at 101.43%, while Kesar Petroprod. has a return of -58.28%.

Peers: The peers of Kesar Petroprod. are IVP, ARCL Organics, ZR2 Bioenergy, Kanchi Karpooram, Archit Organosys, Sh. Hari Chem., AG Ventures, Polychem, and Ritesh Intl.<BR><BR>Quality Snapshot: Excellent management risk is observed at ARCL Organics and Polychem, while Average management risk is found at IVP, Kanchi Karpooram, Sh. Hari Chem., and Ritesh Intl., and the rest have Below Average management risk. Good growth is seen at ARCL Organics, Kesar Petroprod., Sh. Hari Chem., and Polychem, while Below Average growth is present at IVP, ZR2 Bioenergy, Kanchi Karpooram, Archit Organosys, AG Ventures, and the rest. Excellent capital structure is noted at Kanchi Karpooram and AG Ventures, while Good capital structure is found at ARCL Organics and Polychem, Average capital structure is seen at Archit Organosys and Ritesh Intl., and the rest have Below Average capital structure.<BR><BR>Return Snapshot: The peer with the highest 1-year return is Sh. Hari Chem. at 101.43%, while ZR2 Bioenergy has the lowest at -70.89%. Kesar Petroprod.'s 1-year return of -58.28% is significantly lower than Sh. Hari Chem.'s. Additionally, the six-month return is negative for Kesar Petroprod., ZR2 Bioenergy, Polychem, and AG Ventures.

View full answer

How big is Kesar Petroprod.?

01-Sep-2026

As of 31st August, Kesar Petroproducts Ltd has a market capitalization of 149.00 Cr, with net sales of 186.81 Cr and a net profit of 4.29 Cr reported over the latest four quarters.

As of 31st August, Kesar Petroproducts Ltd has a market capitalization of 149.00 Cr, categorizing it as a Micro Cap company.<BR><BR>In the latest four quarters, Kesar Petroproducts Ltd reported net sales of 186.81 Cr and a net profit of 4.29 Cr.<BR><BR>The latest annual period for the balance sheet is March 2025, with shareholder's funds amounting to 143.88 Cr and total assets of 238.29 Cr.

View full answer

Should I buy, sell or hold Kesar Petroproducts Ltd?

16-Aug-2026

Are Kesar Petroproducts Ltd latest results good or bad?

30-May-2026

Kesar Petroproducts Ltd's latest Q4 FY26 results are concerning, showing a net loss of ₹5.06 crores and a negative operating margin of -2.41%, despite a 13.29% revenue increase. The company's stock has declined 25.14% over the past year, indicating significant operational challenges and negative investor sentiment.

Kesar Petroproducts Ltd's latest results for Q4 FY26 are concerning. The company reported a net loss of ₹5.06 crores, which represents a dramatic 273.29% decline compared to the previous quarter. While revenue did increase by 13.29% quarter-on-quarter to ₹46.47 crores, this growth was overshadowed by a significant collapse in operating profitability, with the operating margin turning negative at -2.41%. This marks the lowest operating margin on record for the company.<BR><BR>The stock has also performed poorly, declining 25.14% over the past year, significantly underperforming the broader market. Investor sentiment appears to be negative, as indicated by a sharp drop in stock price following the results announcement and a surge in trading volumes due to heavy selling pressure.<BR><BR>Overall, the results suggest serious operational challenges, raising questions about the company's efficiency and ability to manage costs effectively in a competitive market. The combination of a net loss, negative operating margin, and declining stock performance points to a troubling financial situation for Kesar Petroproducts Ltd.

View full answer

How has been the historical performance of Kesar Petroprod.?

04-Dec-2025

Kesar Petroprod has shown fluctuating but overall positive financial performance, with net sales increasing from 119.96 Cr in Mar'23 to 185.17 Cr in Mar'25, and significant improvements in profitability, including profit after tax rising to 9.96 Cr in Mar'25 from 0.47 Cr in Mar'23. The company also improved its cash flow from operating activities, recovering to 13.00 Cr in Mar'25.

Answer:<BR>The historical performance of Kesar Petroprod shows a fluctuating trend in net sales and profitability over the years, with a notable increase in recent periods.<BR><BR>Breakdown:<BR>Kesar Petroprod's net sales have shown an upward trend, rising from 119.96 Cr in Mar'23 to 185.17 Cr in Mar'25, despite a dip to 148.88 Cr in Mar'24. The total operating income followed a similar pattern, reaching 185.17 Cr in Mar'25. However, raw material costs have significantly increased, from 100.23 Cr in Mar'23 to 155.31 Cr in Mar'25, impacting the overall expenditure, which rose to 169.20 Cr in Mar'25 from 113.39 Cr in Mar'23. The operating profit (PBDIT) improved to 18.45 Cr in Mar'25, up from 8.06 Cr in Mar'23, indicating better operational efficiency. Profit before tax also saw a substantial increase, reaching 13.31 Cr in Mar'25 compared to 0.98 Cr in Mar'23, while profit after tax surged to 9.96 Cr from 0.47 Cr in the same period. The company's total assets increased to 238.29 Cr in Mar'25 from 187.71 Cr in Mar'23, reflecting growth in both current and non-current assets. Cash flow from operating activities improved significantly to 13.00 Cr in Mar'25, contrasting with a negative cash flow of -20.00 Cr in Mar'24, indicating a recovery in cash generation capabilities. Overall, Kesar Petroprod has demonstrated a positive trajectory in its financial performance, particularly in the latest fiscal year.

View full answer

Is Kesar Petroprod. overvalued or undervalued?

26-Nov-2025

As of November 25, 2025, Kesar Petroprod. is considered undervalued with a PE Ratio of 15.16 and strong growth potential, making it an attractive investment compared to peers like Elitecon International and MMTC, despite recent stock performance lagging behind the Sensex.

As of 25 November 2025, Kesar Petroprod. has moved from an expensive to an attractive valuation grade. The company is currently considered undervalued based on its financial metrics. Key ratios include a PE Ratio of 15.16, an EV to EBITDA of 11.99, and a PEG Ratio of 0.20, indicating strong growth potential relative to its price.<BR><BR>In comparison to its peers, Kesar Petroprod. stands out favorably against Elitecon International, which has a PE Ratio of 229.19, and MMTC, which is rated as risky with a PE Ratio of 128.65. Additionally, PTC India, another peer, is rated very attractive with a significantly lower PE Ratio of 7.32. Despite recent stock performance lagging behind the Sensex over the past month and year-to-date, Kesar Petroprod.'s long-term growth potential and attractive valuation suggest it is a compelling investment opportunity.

View full answer

When is the next results date for Kesar Petroprod.?

07-Nov-2025

Kesar Petroprod. will announce its results on 14 November 2025.

Kesar Petroprod. will declare its results on 14 November 2025.

View full answer

What is the technical trend for Kesar Petroprod.?

09-Jun-2025

As of June 6, 2025, Kesar Petroprod's technical trend is mildly bullish, supported by positive weekly indicators like MACD and Bollinger Bands, though daily moving averages suggest short-term caution.

As of 6 June 2025, the technical trend for Kesar Petroprod has changed from mildly bearish to mildly bullish. The weekly MACD and Bollinger Bands are both bullish, supporting a positive outlook. The KST on a weekly basis is mildly bullish as well. However, the daily moving averages indicate a mildly bearish stance, which suggests some short-term caution. The RSI shows no signal on both weekly and monthly time frames, indicating a lack of momentum. Overall, the current technical stance is mildly bullish, driven primarily by the bullish indicators on the weekly charts.

View full answer

Who are the top shareholders of the Kesar Petroprod.?

06-Jun-2025

The top shareholders of Kesar Petroprod include Dinesh Sharma Huf with 30.41%, individual investors with 28.49%, and public shareholder Rajkumar at 5.17%. There are no pledged promoter holdings, and mutual funds and foreign institutional investors hold minimal stakes.

The top shareholders of Kesar Petroprod include the promoters, with Dinesh Sharma Huf holding the highest stake at 30.41%. Additionally, individual investors collectively own 28.49% of the company. The highest public shareholder is Rajkumar, who holds 5.17%. There are also four mutual fund schemes that hold a total of 0.01%, and two foreign institutional investors (FIIs) with a combined holding of 0.37%. Notably, there are no pledged promoter holdings.

View full answer

Has Kesar Petroprod. declared dividend?

06-Jun-2025

Kesar Petroproducts Ltd has declared a 10% dividend, amounting to 1 per share, with an ex-date of September 24, 2015. Despite this, the dividend yield is 0%, as there have been no ongoing dividends, though the company has shown significant price appreciation over various periods.

Kesar Petroproducts Ltd has declared a 10% dividend.<BR><BR>Dividend Details:<BR>- Percentage announced: 10%<BR>- Amount per share: 1 per share<BR>- Ex-date: 24 Sep 15<BR><BR>Dividend Yield: 0%<BR><BR>Total Returns by Period:<BR>In the 6-month period, the price return was -10.61%, the dividend return was 0%, resulting in a total return of -10.61%.<BR><BR>For the 1-year period, the price return was 127.5%, the dividend return was 0%, leading to a total return of 127.5%.<BR><BR>Over the 2-year period, the price return was 281.22%, with a dividend return of 0%, culminating in a total return of 281.22%.<BR><BR>In the 3-year period, the price return was 0%, the dividend return was 0%, resulting in a total return of 0.0%.<BR><BR>For the 4-year period, the price return was 410.48%, with a dividend return of 0%, leading to a total return of 410.48%.<BR><BR>In the 5-year period, the price return was 526.17%, the dividend return was 0%, resulting in a total return of 526.17%.<BR><BR>Overall, Kesar Petroproducts Ltd has declared a dividend, but the dividend yield remains at 0%. The total returns over various periods show significant price appreciation, particularly in the longer terms, despite the absence of ongoing dividends.

View full answer
iScoreScore
Click here to find our call on this stock
Strong Sell
Sell
Hold
Buy
Strong Buy

Dashboard

1

Poor Management Efficiency with a low ROCE of 3.17%

  • The company has been able to generate a Return on Capital Employed (avg) of 3.17% signifying low profitability per unit of total capital (equity and debt)
2

Low ability to service debt as the company has a high Debt to EBITDA ratio of 3.45 times

3

Flat results in Jun 26

4

Underperformed the market in the last 1 year

stock-summaryMojo Parameters

Mojo Parameters

Loading Valuation Snapshot...

Stock DNA

stock-summary
Industry

Commodity Chemicals

stock-summary
Market cap

INR 162 Cr (Micro Cap)

stock-summary
P/E

38.00

stock-summary
Industry P/E

22

stock-summary
Dividend Yield

0.00%

stock-summary
Debt Equity

0.39

stock-summary
Return on Equity

2.87%

stock-summary
Price to Book

1.08

Revenue and Profits:
Net Sales:
49 Cr
(Quarterly Results - Jun 2026)
Net Profit:
1 Cr
stock-summaryTotal Returns
Total Returns (Price + Dividend) stock-summary
Dividend Yield (0%)
TimePeriod
Price Return
Dividend Return
Total Return
3 Months
-15.72%
0%
-15.72%
6 Months
-42.44%
0%
-42.44%
1 Year
-53.27%
0%
-53.27%
2 Years
-27.65%
0%
-27.65%
3 Years
151.94%
0%
151.94%
4 Years
0%
0%
0.0%
5 Years
0%
0%
0.0%

Latest dividend: 0.1 per share ex-dividend date: Sep-24-2015

Risk Adjusted Returns v/s stock-summary
Returns Beta
Icon
Beta has not been calculated since enough price history is not available
stock-summaryNews & Corporate Actions

Announcements stock-summary

Announcement under Regulation 30 (LODR)-Change in Management

18-Aug-2026 | Source : BSE

We hereby inform you that the Board of Directors at its meeting held on 14.08.2026 approved and recommended the re-appointment of Whole Time Director.

Intimation Of Book Closure In Connection With The Annual General Meeting

17-Aug-2026 | Source : BSE

In terms of Regulation 30 of SEBI (LODR) Regulations 2015 as amended attached is an intimation about the Book Closure dates in connecction with 36th AGM of the Company to be held on 28.09.2026 in terms of Regulation 42 of SEBI (LODR) Regulations 2015 and section 91 of the Companies Act 2013. The Book Closure dates are 22/09/2026 to 28/09/2026 (inclusive of both the dates)

Revised Submission Of Rectified Format Of Financial Results For The Quarter Ended June 30 2026 Under Regulation 33 Of SEBI (LODR) Regulations 2015

17-Aug-2026 | Source : BSE

With reference to the submission of Financial Results under Regulation 33 of the SEBI (LODR) Regulations 2015 for the quarter ended 30.06.2026 we wish to inform you that the Standalone Financial Results are being re-submitted in the prescribed format for the purpose of record and compliance.

Corporate Actions stock-summary

stock-summary
BOARD MEETING

No Upcoming Board Meetings

stock-summary
DIVIDEND

Kesar Petroproducts Ltd has declared 10% dividend, ex-date: 24 Sep 15

stock-summary
SPLITS

Kesar Petroproducts Ltd has announced 1:10 stock split, ex-date: 30 Oct 15

stock-summary
BONUS

No Bonus history available

stock-summary
RIGHTS

No Rights history available

stock-summaryKey Factors

Quality key factors stock-summary

Factor
Value
Sales Growth (5y)
10.21%
EBIT Growth (5y)
42.50%
EBIT to Interest (avg)
2.94
Debt to EBITDA (avg)
5.93
Net Debt to Equity (avg)
0.39
Sales to Capital Employed (avg)
0.99
Tax Ratio
18.90%
Dividend Payout Ratio
0
Pledged Shares
0
Institutional Holding
0.13%
ROCE (avg)
3.66%
ROE (avg)
3.67%

Valuation key factors

Factor
Value
P/E Ratio
38
Industry P/E
22
Price to Book Value
1.08
EV to EBIT
28.17
EV to EBITDA
17.03
EV to Capital Employed
1.06
EV to Sales
1.17
PEG Ratio
NA
Dividend Yield
NA
ROCE (Latest)
7.16%
ROE (Latest)
2.87%

Technicals key factors

Indicator
Weekly
Monthly
MACD
Bearish
Bearish
RSI
No Signal
No Signal
Bollinger Bands
Mildly Bearish
Mildly Bearish
Moving Averages
Bearish (Daily)
KST
Bearish
Mildly Bearish
Dow Theory
Mildly Bearish
No Trend
stock-summary Technical Indicator Scale: Bearish, Mildly Bearish, Sideways, Mildly Bullish, Bullish  Turned 
stock-summaryShareholding
Shareholding Snapshot : Jun 2026stock-summary
Shareholding Compare (%holding) stock-summary
Majority shareholders

Promoters

Pledged Promoter Holdings

None

Mutual Funds

Held by 4 Schemes (0.01%)

FIIs

Held by 0 FIIs

Promoter with highest holding

Dinesh Sharma Huf (26.33%)

Highest Public shareholder

Rajkumar (4.48%)

Individual Investors Holdings

26.33%

stock-summaryFinancial
[
  {
    "link": "quarterly",
    "btn_text": "All Quarterly Results",
    "header": "Quarterly Results Snapshot (Standalone) - Jun'26 - QoQ",
    "rhs": [
      {
        "prefix": "Net Sales ",
        "suffix": "QoQ Growth in quarter ended Jun 2026 is 5.70% vs 13.29% in Mar 2026",
        "dir": -1
      },
      {
        "prefix": "Standalone Net Profit ",
        "suffix": "QoQ Growth in quarter ended Jun 2026 is 110.08% vs -273.29% in Mar 2026",
        "dir": 1
      }
    ],
    "table": {
      "header": [
        "Jun'26",
        "Mar'26",
        "Change(%)"
      ],
      "body": [
        {
          "field": "Net Sales",
          "val1": "49.12",
          "val2": "46.47",
          "chgp": "5.70%",
          "chgp_class": "positive"
        },
        {
          "field": "Operating Profit (PBDIT) excl Other Income",
          "val1": "0.51",
          "val2": "-1.12",
          "chgp": "145.54%",
          "chgp_class": "positive"
        },
        {
          "field": "Interest",
          "val1": "0.00",
          "val2": "1.52",
          "chgp": "-100.00%",
          "chgp_class": "positive"
        },
        {
          "field": "Exceptional Items",
          "val1": "0.00",
          "val2": "0.00",
          "chgp": "",
          "chgp_class": "neutral"
        },
        {
          "field": "Standalone Net Profit",
          "val1": "0.51",
          "val2": "-5.06",
          "chgp": "110.08%",
          "chgp_class": "positive"
        },
        {
          "field": "Operating Profit Margin (Excl OI)",
          "val1": "1.04%",
          "val2": "-2.41%",
          "chgp": "3.45%",
          "chgp_class": "positive"
        }
      ]
    }
  },
  {
    "link": "half-yearly",
    "btn_text": "All Half Yearly Results",
    "header": "Half Yearly Results Snapshot (Standalone) - Sep'25",
    "rhs": [
      {
        "prefix": "Net Sales ",
        "suffix": " Growth in half year ended Sep 2025 is 5.51% vs 48.83% in Sep 2024",
        "dir": -1
      },
      {
        "prefix": "Standalone Net Profit ",
        "suffix": " Growth in half year ended Sep 2025 is 134.52% vs 1,020.00% in Sep 2024",
        "dir": -1
      }
    ],
    "table": {
      "header": [
        "Sep'25",
        "Sep'24",
        "Change(%)"
      ],
      "body": [
        {
          "field": "Net Sales",
          "val1": "99.73",
          "val2": "94.52",
          "chgp": "5.51%",
          "chgp_class": "positive"
        },
        {
          "field": "Operating Profit (PBDIT) excl Other Income",
          "val1": "15.76",
          "val2": "6.54",
          "chgp": "140.98%",
          "chgp_class": "positive"
        },
        {
          "field": "Interest",
          "val1": "1.06",
          "val2": "0.60",
          "chgp": "76.67%",
          "chgp_class": "negative"
        },
        {
          "field": "Exceptional Items",
          "val1": "0.00",
          "val2": "0.00",
          "chgp": "",
          "chgp_class": "neutral"
        },
        {
          "field": "Standalone Net Profit",
          "val1": "11.82",
          "val2": "5.04",
          "chgp": "134.52%",
          "chgp_class": "positive"
        },
        {
          "field": "Operating Profit Margin (Excl OI)",
          "val1": "15.80%",
          "val2": "6.92%",
          "chgp": "8.88%",
          "chgp_class": "positive"
        }
      ]
    }
  },
  {
    "link": "nine-monthly",
    "btn_text": "All Nine Monthly Results",
    "header": "Nine Monthly Results Snapshot (Standalone) - Dec'25",
    "rhs": [
      {
        "prefix": "Net Sales ",
        "suffix": "YoY Growth in nine months ended Dec 2025 is -2.38% vs 45.23% in Dec 2024",
        "dir": -1
      },
      {
        "prefix": "Standalone Net Profit ",
        "suffix": "YoY Growth in nine months ended Dec 2025 is 84.71% vs 315.63% in Dec 2024",
        "dir": -1
      }
    ],
    "table": {
      "header": [
        "Dec'25",
        "Dec'24",
        "Change(%)"
      ],
      "body": [
        {
          "field": "Net Sales",
          "val1": "140.75",
          "val2": "144.18",
          "chgp": "-2.38%",
          "chgp_class": "negative"
        },
        {
          "field": "Operating Profit (PBDIT) excl Other Income",
          "val1": "22.04",
          "val2": "11.01",
          "chgp": "100.18%",
          "chgp_class": "positive"
        },
        {
          "field": "Interest",
          "val1": "2.39",
          "val2": "0.99",
          "chgp": "141.41%",
          "chgp_class": "negative"
        },
        {
          "field": "Exceptional Items",
          "val1": "0.00",
          "val2": "0.00",
          "chgp": "",
          "chgp_class": "neutral"
        },
        {
          "field": "Standalone Net Profit",
          "val1": "14.74",
          "val2": "7.98",
          "chgp": "84.71%",
          "chgp_class": "positive"
        },
        {
          "field": "Operating Profit Margin (Excl OI)",
          "val1": "15.66%",
          "val2": "7.64%",
          "chgp": "8.02%",
          "chgp_class": "positive"
        }
      ]
    }
  },
  {
    "link": "annual",
    "btn_text": "All Annual Results",
    "header": "Annual Results Snapshot (Standalone) - Mar'26",
    "rhs": [
      {
        "prefix": "Net Sales ",
        "suffix": "YoY Growth in year ended Mar 2026 is 1.11% vs 24.38% in Mar 2025",
        "dir": -1
      },
      {
        "prefix": "Standalone Net Profit ",
        "suffix": "YoY Growth in year ended Mar 2026 is -2.81% vs 100.40% in Mar 2025",
        "dir": -1
      }
    ],
    "table": {
      "header": [
        "Mar'26",
        "Mar'25",
        "Change(%)"
      ],
      "body": [
        {
          "field": "Net Sales",
          "val1": "187.22",
          "val2": "185.17",
          "chgp": "1.11%",
          "chgp_class": "positive"
        },
        {
          "field": "Operating Profit (PBDIT) excl Other Income",
          "val1": "20.91",
          "val2": "15.97",
          "chgp": "30.93%",
          "chgp_class": "positive"
        },
        {
          "field": "Interest",
          "val1": "3.91",
          "val2": "1.39",
          "chgp": "181.29%",
          "chgp_class": "negative"
        },
        {
          "field": "Exceptional Items",
          "val1": "0.00",
          "val2": "0.00",
          "chgp": "",
          "chgp_class": "neutral"
        },
        {
          "field": "Standalone Net Profit",
          "val1": "9.68",
          "val2": "9.96",
          "chgp": "-2.81%",
          "chgp_class": "negative"
        },
        {
          "field": "Operating Profit Margin (Excl OI)",
          "val1": "11.17%",
          "val2": "8.62%",
          "chgp": "2.55%",
          "chgp_class": "positive"
        }
      ]
    }
  }
]

Quarterly Results Snapshot (Standalone) - Jun'26 - QoQstock-summary

Jun'26
Mar'26
Change(%)
Net Sales
49.12
46.47
5.70%
Operating Profit (PBDIT) excl Other Income
0.51
-1.12
145.54%
Interest
0.00
1.52
-100.00%
Exceptional Items
0.00
0.00
Standalone Net Profit
0.51
-5.06
110.08%
Operating Profit Margin (Excl OI)
1.04%
-2.41%
3.45%
Values in Rs Cr.
Direction Arrows
Net Sales

QoQ Growth in quarter ended Jun 2026 is 5.70% vs 13.29% in Mar 2026

Direction Arrows
Standalone Net Profit

QoQ Growth in quarter ended Jun 2026 is 110.08% vs -273.29% in Mar 2026

Half Yearly Results Snapshot (Standalone) - Sep'25stock-summary

Sep'25
Sep'24
Change(%)
Net Sales
99.73
94.52
5.51%
Operating Profit (PBDIT) excl Other Income
15.76
6.54
140.98%
Interest
1.06
0.60
76.67%
Exceptional Items
0.00
0.00
Standalone Net Profit
11.82
5.04
134.52%
Operating Profit Margin (Excl OI)
15.80%
6.92%
8.88%
Values in Rs Cr.
Direction Arrows
Net Sales

Growth in half year ended Sep 2025 is 5.51% vs 48.83% in Sep 2024

Direction Arrows
Standalone Net Profit

Growth in half year ended Sep 2025 is 134.52% vs 1,020.00% in Sep 2024

Nine Monthly Results Snapshot (Standalone) - Dec'25stock-summary

Dec'25
Dec'24
Change(%)
Net Sales
140.75
144.18
-2.38%
Operating Profit (PBDIT) excl Other Income
22.04
11.01
100.18%
Interest
2.39
0.99
141.41%
Exceptional Items
0.00
0.00
Standalone Net Profit
14.74
7.98
84.71%
Operating Profit Margin (Excl OI)
15.66%
7.64%
8.02%
Values in Rs Cr.
Direction Arrows
Net Sales

YoY Growth in nine months ended Dec 2025 is -2.38% vs 45.23% in Dec 2024

Direction Arrows
Standalone Net Profit

YoY Growth in nine months ended Dec 2025 is 84.71% vs 315.63% in Dec 2024

Annual Results Snapshot (Standalone) - Mar'26stock-summary

Mar'26
Mar'25
Change(%)
Net Sales
187.22
185.17
1.11%
Operating Profit (PBDIT) excl Other Income
20.91
15.97
30.93%
Interest
3.91
1.39
181.29%
Exceptional Items
0.00
0.00
Standalone Net Profit
9.68
9.96
-2.81%
Operating Profit Margin (Excl OI)
11.17%
8.62%
2.55%
Values in Rs Cr.
Direction Arrows
Net Sales

YoY Growth in year ended Mar 2026 is 1.11% vs 24.38% in Mar 2025

Direction Arrows
Standalone Net Profit

YoY Growth in year ended Mar 2026 is -2.81% vs 100.40% in Mar 2025

stock-summaryCompany CV
About Kesar Petroproducts Ltd stock-summary
stock-summary
Kesar Petroproducts Ltd
Micro Cap
Commodity Chemicals
Promoted in the joint sector by Maharashtra Petrochemicals Corporation and Sobhagya Mercantile, Kesar Petroproducts Limited was incorporated in Jan.'90. The Company is a leading manufacturers of Phthalocyanine Blue Crude. It is into manufacturing Phthalocyanine range of pigments and Dye Intermediates.
Company Coordinates stock-summary
Company Details
D-7/1 MIDC Industrial Area, Lote Parshuram Taluka - Khed Ratnagiri Maharashtra : 415722
stock-summary
Tel: 91-02356-272339
stock-summary
info@kesarpetroproducts.com
Registrar Details
Link Intime India Pvt Ltd, C-13 Pannalal Silk Compound, L B S Marg, Bhandup , Mumbai