
Compare Khaitan (India) with Similar Stocks
Dashboard
Weak Long Term Fundamental Strength with an average Return on Capital Employed (ROCE) of 9.38%
- Company's ability to service its debt is weak with a poor EBIT to Interest (avg) ratio of 1.22
Positive results in Mar 26
With ROCE of 19.2, it has a Attractive valuation with a 2 Enterprise value to Capital Employed
32.85% of Promoter Shares are Pledged
Consistent Returns over the last 3 years
Stock DNA
Electronics & Appliances
INR 65 Cr (Micro Cap)
13.00
19
0.00%
0.34
22.20%
2.31
Total Returns (Price + Dividend) 
Khaitan (India) for the last several years.
Risk Adjusted Returns v/s
Returns Beta

News
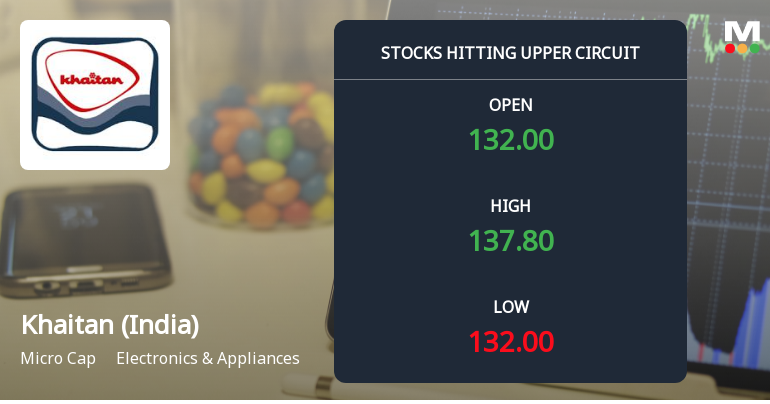
Khaitan (India) Ltd Locks at Upper Circuit With 5% Gain — Buyers Queue, Sellers Absent
At Rs 134.55, the buying was done — not because demand dried up, but because the exchange wouldn't let the stock go any higher. Khaitan (India) Ltd locked at its upper circuit of 4.99% on 23 Jun 2026, with buyers queuing and no sellers willing to part with shares.
Read full news article
Khaitan (India) Ltd Locks at Upper Circuit With 5.0% Gain — Buyers Queue, Sellers Absent
At Rs 130.46, the buying was done — not because demand dried up, but because the exchange wouldn't let the stock go any higher. Khaitan (India) Ltd locked at its upper circuit of 5.0% on 22 Jun 2026, with buyers queuing and no sellers willing to part with shares.
Read full news article
Khaitan (India) Ltd is Rated Hold by MarketsMOJO
Khaitan (India) Ltd is rated 'Hold' by MarketsMOJO, with this rating last updated on 14 May 2026. While the rating was assigned on that date, the analysis and financial metrics discussed here reflect the stock's current position as of 17 June 2026, providing investors with an up-to-date view of the company’s fundamentals, valuation, financial trends, and technical outlook.
Read full news article Announcements
Khaitan (India) Limited - Trading Window
21-Nov-2019 | Source : NSEKhaitan (India) Limited has informed the Exchange regarding the Trading Window closure pursuant to SEBI (Prohibition of Insider Trading) Regulations, 2015
Khaitan (India) Limited - Trading Window
14-Nov-2019 | Source : NSEKhaitan (India) Limited has informed the Exchange regarding the Trading Window closure pursuant to SEBI (Prohibition of Insider Trading) Regulations, 2015
Khaitan (India) Limited - Trading Window
04-Nov-2019 | Source : NSEKhaitan (India) Limited has informed the Exchange regarding the Trading Window closure pursuant to SEBI (Prohibition of Insider Trading) Regulations, 2015
Corporate Actions

No Upcoming Board Meetings

No Dividend history available

No Splits history available

No Bonus history available

No Rights history available
Quality key factors
Valuation key factors
Technicals key factors
 Technical Indicator Scale: Bearish, Mildly Bearish, Sideways, Mildly Bullish, Bullish Turned
 Shareholding Snapshot : Mar 2026
Shareholding Compare (%holding)
Promoters
32.8484
Held by 0 Schemes
Held by 0 FIIs
Khaitan Lefin Limited (23.82%)
Seetha Kumari . . (1.17%)
32.37%
Quarterly Results Snapshot (Standalone) - Mar'26 - QoQ

QoQ Growth in quarter ended Mar 2026 is 34.77% vs 37.03% in Dec 2025
QoQ Growth in quarter ended Mar 2026 is 137.10% vs 264.71% in Dec 2025
Half Yearly Results Snapshot (Standalone) - Sep'25

Growth in half year ended Sep 2025 is 44.15% vs 19.07% in Sep 2024
Growth in half year ended Sep 2025 is -31.41% vs 1,485.00% in Sep 2024
Nine Monthly Results Snapshot (Standalone) - Dec'25
YoY Growth in nine months ended Dec 2025 is 46.15% vs 22.73% in Dec 2024
YoY Growth in nine months ended Dec 2025 is -11.30% vs 661.90% in Dec 2024
Annual Results Snapshot (Consolidated) - Mar'26
YoY Growth in year ended Mar 2026 is 44.61% vs 48.51% in Mar 2025
YoY Growth in year ended Mar 2026 is -13.32% vs 312.16% in Mar 2025
About Khaitan (India) Ltd

Company Coordinates


