
Compare Khandwala Sec. with Similar Stocks
Stock DNA
Capital Markets
INR 26 Cr (Micro Cap)
NA (Loss Making)
21
0.00%
0.10
-4.61%
0.99
Total Returns (Price + Dividend) 
Khandwala Sec. for the last several years.
Risk Adjusted Returns v/s
Returns Beta

News
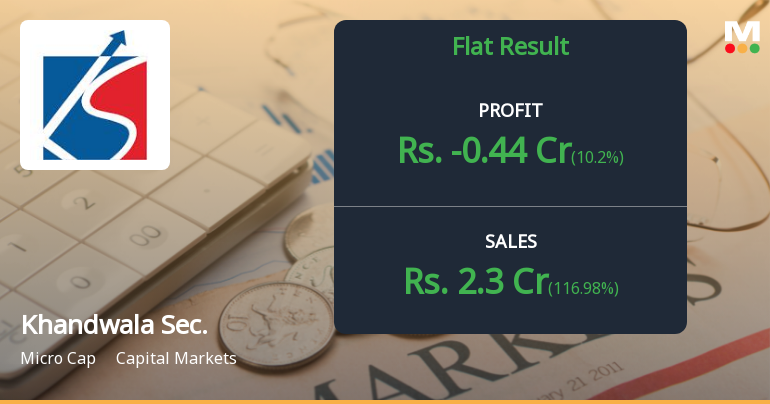
Khandwala Securities Q4 FY26: Losses Deepen Despite Revenue Surge
Khandwala Securities Ltd., a Mumbai-based institutional dealing and investment banking firm, reported a net loss of ₹0.44 crores for the quarter ended March 2026, marking the third consecutive quarter of losses despite a robust 116.98% quarter-on-quarter revenue surge. The company's stock, trading at ₹17.99, has declined 17.17% over the past year, significantly underperforming the Sensex's 7.86% decline and its own Capital Markets sector peers by 23.55 percentage points.
Read full news articleWhen is the next results date for Khandwala Securities Ltd?
The next results date for Khandwala Securities Ltd is scheduled for 21 May 2026....
Read full news article
Khandwala Securities Ltd is Rated Strong Sell
Khandwala Securities Ltd is rated Strong Sell by MarketsMOJO, with this rating last updated on 06 Feb 2025. However, the analysis and financial metrics discussed here reflect the company’s current position as of 15 May 2026, providing investors with an up-to-date view of its fundamentals, valuation, financial trends, and technical outlook.
Read full news article Announcements
Closure of Trading Window
24-Jun-2026 | Source : BSEPlease find enclosed intimation of closure of trading window
Intimation Regarding Receipt Of SEBI Letter
11-Jun-2026 | Source : BSEPlease find enclosed Intimation in relation to letter received from SEBI on June 10 2026
Compliances-Reg.24(A)-Annual Secretarial Compliance
22-May-2026 | Source : BSEPlease find enclosed herewith the Annual Secretarial Compliance Report for the financial year ended March 31 2026
Corporate Actions

No Upcoming Board Meetings

No Dividend history available

No Splits history available

No Bonus history available

No Rights history available
Quality key factors
Valuation key factors
Technicals key factors
 Technical Indicator Scale: Bearish, Mildly Bearish, Sideways, Mildly Bullish, Bullish Turned
 Shareholding Snapshot : Mar 2026
Shareholding Compare (%holding)
Non Institution
23.3182
Held by 0 Schemes
Held by 0 FIIs
Jayantilal Khandwala & Sons Pvt. Ltd. (11.36%)
Poonam Balram Bharwani (5.08%)
41.39%
Quarterly Results Snapshot (Consolidated) - Mar'26 - QoQ

QoQ Growth in quarter ended Mar 2026 is 116.98% vs -68.82% in Dec 2025
QoQ Growth in quarter ended Mar 2026 is 10.20% vs -304.17% in Dec 2025
Half Yearly Results Snapshot (Consolidated) - Sep'25

Growth in half year ended Sep 2025 is -19.79% vs 60.34% in Sep 2024
Growth in half year ended Sep 2025 is -147.89% vs 184.00% in Sep 2024
Nine Monthly Results Snapshot (Consolidated) - Dec'25
YoY Growth in nine months ended Dec 2025 is -33.01% vs 46.92% in Dec 2024
YoY Growth in nine months ended Dec 2025 is -166.40% vs 140.38% in Dec 2024
Annual Results Snapshot (Consolidated) - Mar'26
YoY Growth in year ended Mar 2026 is -17.30% vs 11.97% in Mar 2025
YoY Growth in year ended Mar 2026 is -58.75% vs -570.59% in Mar 2025
About Khandwala Securities Ltd

Company Coordinates


