
Compare Kilitch Drugs with Similar Stocks
Dashboard
Poor Management Efficiency with a low ROE of 8.85%
- The company has been able to generate a Return on Equity (avg) of 8.85% signifying low profitability per unit of shareholders funds
Company has a Debt to Equity ratio (avg) of 0.01 times
Healthy long term growth as Operating profit has grown by an annual rate 59.44%
With ROE of 10.8, it has a Fair valuation with a 2.4 Price to Book Value
Despite the size of the company, domestic mutual funds hold only 0% of the company
Stock DNA
Pharmaceuticals & Biotechnology
INR 599 Cr (Micro Cap)
22.00
33
0.00%
0.07
10.79%
2.06
Total Returns (Price + Dividend) 
Latest dividend: 0.5 per share ex-dividend date: Sep-20-2019
Risk Adjusted Returns v/s
Returns Beta

News
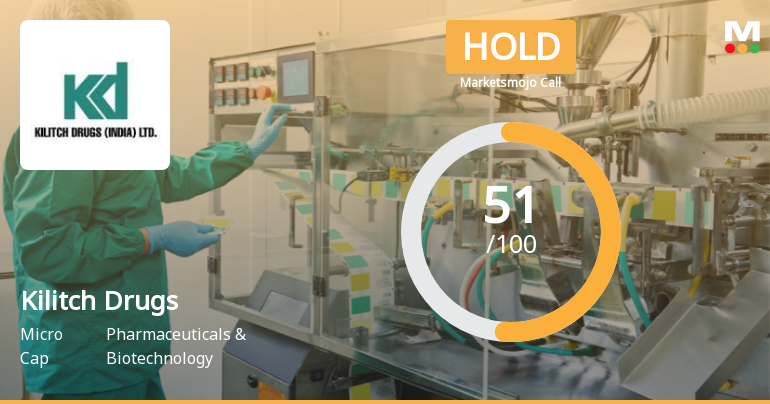
Kilitch Drugs Upgraded to Hold as Technicals Improve Amid Mixed Financial Signals
Kilitch Drugs (India) Ltd has seen its investment rating upgraded from Sell to Hold, reflecting a nuanced improvement across technical indicators, valuation metrics, financial trends, and quality parameters. Despite recent price volatility and a challenging one-year return, the company’s underlying fundamentals and technical signals have prompted a reassessment of its market stance.
Read full news article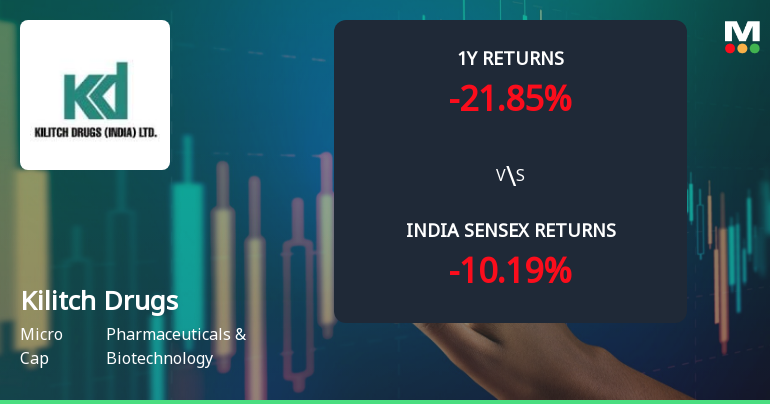
Kilitch Drugs (India) Ltd Technical Momentum Shifts Amid Mixed Market Signals
Kilitch Drugs (India) Ltd has experienced a notable shift in its technical momentum, transitioning from a sideways trend to a mildly bearish stance. Despite mixed signals from key technical indicators such as MACD, RSI, and moving averages, the stock’s recent price action and broader market context suggest a complex outlook for investors navigating the Pharmaceuticals & Biotechnology sector.
Read full news article
Kilitch Drugs (India) Ltd Faces Mixed Technical Signals Amid Price Momentum Shift
Kilitch Drugs (India) Ltd, a micro-cap player in the Pharmaceuticals & Biotechnology sector, has recently experienced a shift in its technical momentum, moving from a sideways trend to a mildly bearish stance. Despite some bullish weekly indicators, monthly signals suggest caution, reflected in the company’s downgrade from Hold to Sell by MarketsMOJO on 1 June 2026.
Read full news article Announcements
Compliances-Reg.24(A)-Annual Secretarial Compliance
27-May-2026 | Source : BSEWe are hereby submitting annual secretarial compliance report for the year ended 31st March 2026
Announcement under Regulation 30 (LODR)-Newspaper Publication
18-May-2026 | Source : BSEWe are submitting hereby copy of newspaper publication of the extract of financial results for the quarter ended 31st March 2026
Audited Standalone And Consolidated Financial Results For The Quarter Ended 31St March 2026
15-May-2026 | Source : BSEWe are hereby submitting audited standalone and consolidated financial results for the quarter ended 31st March 2026
Corporate Actions

No Upcoming Board Meetings

Kilitch Drugs (India) Ltd has declared 5% dividend, ex-date: 20 Sep 19

No Splits history available

Kilitch Drugs (India) Ltd has announced 1:1 bonus issue, ex-date: 24 Mar 26

Kilitch Drugs (India) Ltd has announced 2:23 rights issue, ex-date: 15 Jul 25
Quality key factors
Valuation key factors
Technicals key factors
 Technical Indicator Scale: Bearish, Mildly Bearish, Sideways, Mildly Bullish, Bullish Turned
 Shareholding Snapshot : Mar 2026
Shareholding Compare (%holding)
Promoters
None
Held by 0 Schemes
Held by 2 FIIs (0.0%)
Kilitch Company (pharma) Limited (37.92%)
Dipak Kanayalal Shah (3.64%)
29.7%
Quarterly Results Snapshot (Consolidated) - Mar'26 - QoQ

QoQ Growth in quarter ended Mar 2026 is 66.51% vs 10.00% in Dec 2025
QoQ Growth in quarter ended Mar 2026 is 227.77% vs -45.91% in Dec 2025
Half Yearly Results Snapshot (Consolidated) - Sep'25
Growth in half year ended Sep 2025 is 13.75% vs 4.08% in Sep 2024

Growth in half year ended Sep 2025 is 12.65% vs 22.96% in Sep 2024
Nine Monthly Results Snapshot (Consolidated) - Dec'25
YoY Growth in nine months ended Dec 2025 is 6.40% vs 25.15% in Dec 2024
YoY Growth in nine months ended Dec 2025 is -1.70% vs 44.60% in Dec 2024
Annual Results Snapshot (Consolidated) - Mar'26
YoY Growth in year ended Mar 2026 is 18.73% vs 28.47% in Mar 2025
YoY Growth in year ended Mar 2026 is 13.00% vs 82.88% in Mar 2025
About Kilitch Drugs (India) Ltd

Company Coordinates


