
Compare Kimia Bioscien. with Similar Stocks
Dashboard
High Debt company with Weak Long Term Fundamental Strength
- Poor long term growth as Net Sales has grown by an annual rate of -2.84% over the last 5 years
- High Debt Company with a Debt to Equity ratio (avg) of 14.13 times
- The company has been able to generate a Return on Capital Employed (avg) of 9.76% signifying low profitability per unit of total capital (equity and debt)
- PBT LESS OI(Q) At Rs 0.75 cr has Fallen at -74.9% (vs previous 4Q average)
- PAT(Q) At Rs 0.37 cr has Fallen at -83.6% (vs previous 4Q average)
- NET SALES(Q) At Rs 27.20 cr has Fallen at -13.6% (vs previous 4Q average)
Below par performance in long term as well as near term
Stock DNA
Pharmaceuticals & Biotechnology
INR 148 Cr (Micro Cap)
20.00
27
0.00%
3.05
64.16%
13.12
Total Returns (Price + Dividend) 
Kimia Bioscien. for the last several years.
Risk Adjusted Returns v/s
Returns Beta

News
Kimia Biosciences Downgraded to Strong Sell Amid Weak Financials and Bearish Technicals
Kimia Biosciences Ltd has been downgraded from a Sell to a Strong Sell rating as of 27 Jul 2026, reflecting deteriorating fundamentals and a shift to bearish technical indicators. The micro-cap pharmaceutical company’s financial performance has weakened significantly, while valuation and technical trends have also contributed to the negative outlook.
Read full news article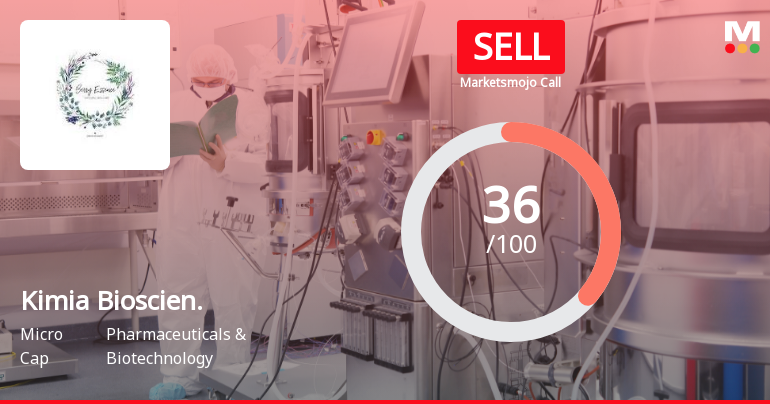
Kimia Biosciences Ltd Upgraded to Sell on Technical Improvements Despite Weak Fundamentals
Kimia Biosciences Ltd has seen its investment rating upgraded from Strong Sell to Sell, reflecting a nuanced shift in its technical outlook amid persistent fundamental challenges. While the company’s financial performance remains under pressure, recent technical indicators have improved, prompting a reassessment of its near-term prospects.
Read full news article
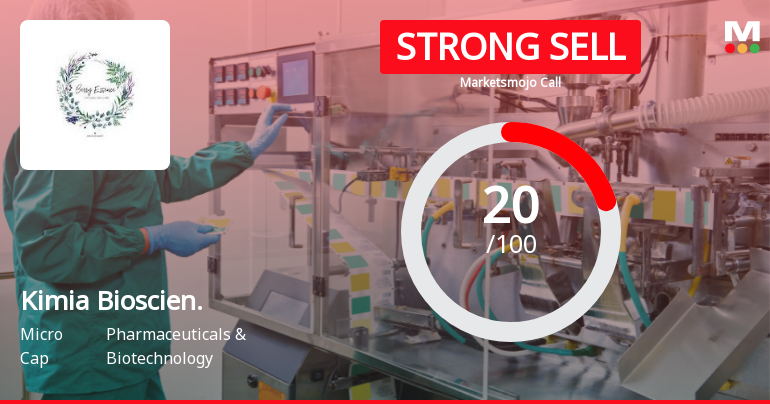
Kimia Biosciences Ltd is Rated Strong Sell
Kimia Biosciences Ltd is rated Strong Sell by MarketsMOJO. This rating was last updated on 17 June 2026, reflecting a significant reassessment of the stock’s outlook. However, all fundamentals, returns, and financial metrics discussed here are current as of 21 July 2026, providing investors with the latest view of the company’s position in the market.
Read full news article Announcements
Closure of Trading Window
27-Jun-2026 | Source : BSEClosure of Trading window for quarter ending June 30 2026
Announcement under Regulation 30 (LODR)-Newspaper Publication
01-Jun-2026 | Source : BSEPublication of Results for quarter and year ended March 31 2026
Outcome Of The Board Meeting Held On 29 May 2026
29-May-2026 | Source : BSEApproval of Audited standalone Financial results alongwith Audited Report thereon for financial year 2025-26
Corporate Actions

No Upcoming Board Meetings

No Dividend history available

No Splits history available

No Bonus history available

No Rights history available
Quality key factors
Valuation key factors
Technicals key factors
 Technical Indicator Scale: Bearish, Mildly Bearish, Sideways, Mildly Bullish, Bullish Turned
 Shareholding Snapshot : Jun 2026
Shareholding Compare (%holding)
Promoters
None
Held by 3 Schemes (0.38%)
Held by 0 FIIs
Sameer Goel (74.94%)
Anish Kumar Aggarwal (4.33%)
22.88%
Quarterly Results Snapshot (Standalone) - Mar'26 - QoQ

QoQ Growth in quarter ended Mar 2026 is -9.63% vs -11.47% in Dec 2025

QoQ Growth in quarter ended Mar 2026 is -93.20% vs 433.33% in Dec 2025
Half Yearly Results Snapshot (Standalone) - Sep'25
Growth in half year ended Sep 2025 is 13.84% vs 4.44% in Sep 2024
Growth in half year ended Sep 2025 is -46.89% vs 159.22% in Sep 2024
Nine Monthly Results Snapshot (Standalone) - Dec'25
YoY Growth in nine months ended Dec 2025 is 8.68% vs 8.19% in Dec 2024
YoY Growth in nine months ended Dec 2025 is -7.35% vs 207.32% in Dec 2024
Annual Results Snapshot (Standalone) - Mar'26
YoY Growth in year ended Mar 2026 is -3.40% vs 13.39% in Mar 2025
YoY Growth in year ended Mar 2026 is -22.68% vs 280.98% in Mar 2025
About Kimia Biosciences Ltd

Company Coordinates


